
Social Media Engagement Rate Explained
Master your social media engagement rate with 2026 benchmarks, exact formulas, and X-specific strategies to build an authentic, data-driven audience.

Most advice about social media engagement rate starts with the wrong question: “What's a good rate?” That question assumes the metric has one stable meaning across every network. It doesn't.
A percentage calculated from followers tells you something different from one calculated from reach, impressions, or views. Platform design adds another layer of distortion. A discovery-led short-form video feed can expose a post far beyond its follower base, while a text-first real-time feed depends more heavily on timing, conversation, and network proximity. Compare those percentages without normalizing the inputs, and you can end up copying the wrong format, abandoning a healthy channel, or optimizing for likes that never create audience loyalty.
For founders and creators growing on X, the practical answer is to define the denominator, compare like with like, and watch what happens immediately after publishing. Early reply velocity, thread participation, reposts, and meaningful clicks often reveal more about audience health than a headline engagement percentage.
The Myth of a Universal Engagement Rate
There is no universal “good” engagement rate. Published guidance varies because platforms and vendors use different formulas, audience samples, content mixes, and reporting conventions. Hootsuite's engagement-rate guidance places a generally good rate between 1.3% and 3.5% and reports X at 1.8%, while Adobe's 2025 benchmark guide uses much lower X ranges, from 0.04% to 0.15%. Buffer's 2026 benchmark set reports median engagement of about 2.5% on X and 3.6% on Threads, using a different benchmark framework.
Those figures aren't necessarily contradictory. They may describe different denominators. The basic rate can be calculated as interactions divided by followers, reach, impressions, or views. Change the denominator and you change the percentage, even when the underlying post and interactions remain exactly the same.
Practical rule: Never record an engagement percentage without recording the formula beside it.
A follower-based rate gives you a relatively stable account-level comparison. A reach-based rate asks how many people who saw the post interacted with it. An impressions-based rate includes repeated exposure, which can make the result lower when the same users see a post several times. A views-based rate is more appropriate for video, but repeat views can also affect interpretation.
Why cross-platform comparisons fail
TikTok, Instagram, LinkedIn, Facebook, and X don't distribute content in the same way or emphasize the same actions. A short-form video can reach non-followers through recommendation systems, while a post on X may depend on early replies, reposts, and participation from adjacent creator networks. The resulting rates reflect platform mechanics as much as content quality.
That's why comparing a TikTok percentage directly with an X percentage is a strategic trap. If you treat the higher number as proof that the content strategy is superior, you might move resources toward a format that generates passive exposure rather than discussion, qualified clicks, or repeat participation.
The better interpretation is comparative, not absolute. Use the social media engagement rate to compare similar posts on the same platform, with the same denominator, audience type, content format, and reporting window. For a useful distinction between audience actions and the rate used to contextualize them, see the difference between engagement and engagement rate.
Core Formulas and Calculation Examples
Before changing your content, audit the calculation. Analytics dashboards often label several different measures as “engagement rate,” and a clean-looking report can still combine incompatible inputs.
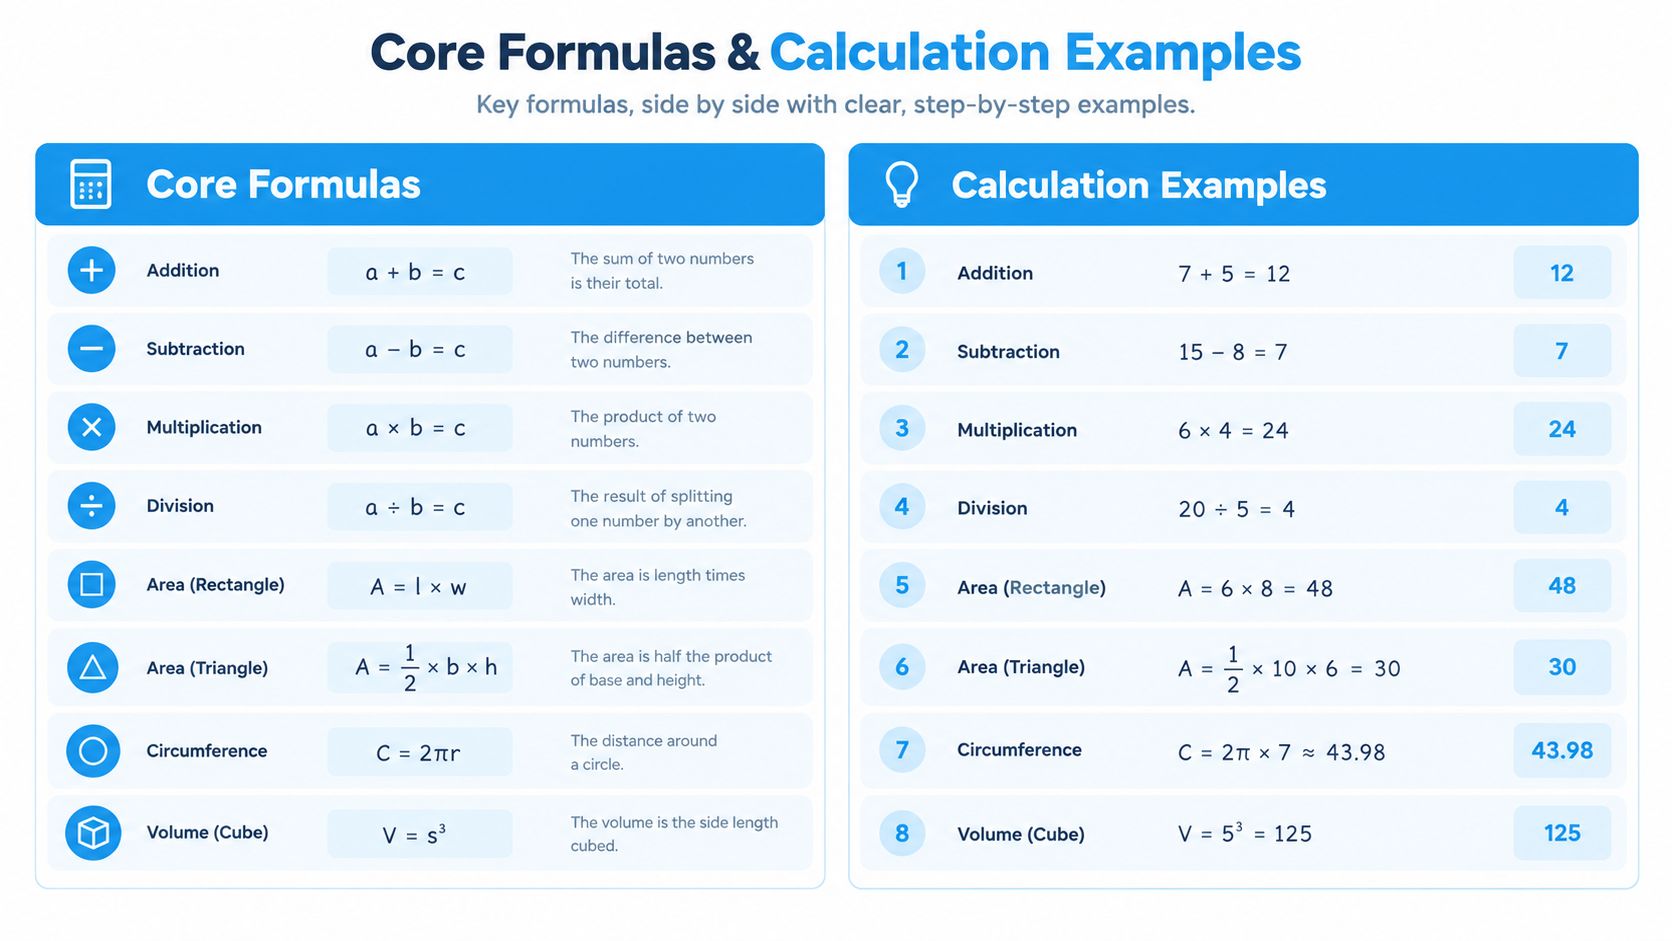
The two most useful starting formulas are:
- Follower-based rate: total interactions ÷ total followers × 100
- Reach-based rate: total interactions ÷ total reach × 100
The same logic applies when the denominator is impressions or views. The formula isn't difficult. The discipline lies in deciding which question you want the number to answer.
Audit a follower-based rate
Suppose an X account has 10,000 followers and a post receives 120 likes, 20 replies, 15 reposts, and 5 quote posts. Total interactions equal 160.
The calculation is:
160 ÷ 10,000 × 100 = 1.6%
This result answers a specific question: how much interaction did the post generate relative to the account's follower base? It provides a consistent baseline for comparing posts over time, but it doesn't tell you how many followers saw the post.
Audit a reach-based rate
Now use the same 160 interactions with a post that reached 4,000 people:
160 ÷ 4,000 × 100 = 4%
The rate is higher because reach is smaller than the follower base. That doesn't mean the post suddenly became more engaging. It means the denominator now measures people who received exposure rather than people who follow the account.
For paid campaigns or repeated distribution, impressions can be more informative. If the post generated 160 interactions from 8,000 impressions, the impressions-based rate would be:
160 ÷ 8,000 × 100 = 2%
Define interactions before adding them
Your numerator needs a written definition. On X, teams commonly include likes, replies, reposts, quote posts, and clicks, but dashboards may group or exclude actions differently. Passive exposure, such as impressions or video views, shouldn't be added to the interaction total unless the platform's documented metric explicitly defines it that way.
The social media impressions guide is useful when you need to separate exposure from active response. For an X growth dashboard, keep the raw counts visible, then show the calculated rate beside them. That makes sudden changes easier to diagnose instead of hiding them behind one blended percentage.
2026 Platform Benchmarks and the X Reality
Benchmark data makes one point clear: platform context matters. A widely cited 2026 benchmark set reports median engagement rates of about 6.2% on LinkedIn, 5.6% on Facebook, and 5.5% on Instagram. Another industry summary places average rates across major platforms roughly between 1.4% and 2.8%, depending on the network and calculation method. Those ranges shouldn't be merged into one league table because they use different reporting conventions.
| Platform | Median engagement rate | Primary content format |
|---|---|---|
| About 6.2% | Professional posts and documents | |
| About 5.6% | Mixed feed content | |
| About 5.5% | Visual posts and short-form video |
Source definitions matter more than the order in this table. The 2026 social media engagement benchmark analysis from Buffer explains that modern reports often use medians rather than simple averages and that vendors may calculate the rate against followers, reach, or impressions.
X operates under different conditions
X has historically reported lower engagement than visual-first networks. One benchmark set recorded X at 0.015% in 2024 before it rebounded to 0.03% in 2025, described as its first meaningful improvement in several years. A separate analysis of 70 million posts covering 2024 and 2025 placed follower-based engagement at around 0.12% for X, compared with 0.48% for Instagram and 3.70% for TikTok. Quid's 2026 benchmark report presents this contrast as a platform-design issue, not a universal quality score.
That distinction matters for founders. X is a high-volume, real-time feed where the value of a post may appear through replies, quote posts, profile visits, or participation in a technical conversation. A lower raw percentage doesn't automatically mean the account is failing. It may indicate that your content is being judged by the wrong comparison set.
Set a baseline you can defend
Use one formula for your X reporting period, separate original posts from replies and threads, and compare content within a consistent audience and format mix. Track the median of your own posts rather than letting one viral spike define the account.
This practical guide to calculating Twitter engagement rate can help you standardize the calculation at post and account level. The benchmark is useful only after your internal measurement is stable.
How Algorithms and Formats Distort Metrics
A high engagement rate can describe genuine audience interest, algorithmic distribution, or a temporary spike from a narrow audience. It can also reflect the content format more than the strength of the relationship between creator and audience.
Short-form video makes this especially visible. Recommendation systems can distribute a video to people who don't follow the account, so the post's reach expands independently of the creator's existing audience. TikTok's benchmark performance illustrates the effect: Emplifi reported median engagement peaking at 35.9% in Q3 2025 before easing to 27.6% in Q4 2025, while Socialinsider reported TikTok rising from 2.50% in 2024 to 3.70% in 2025. These figures come from different datasets, which is precisely why the numbers shouldn't be treated as a single market truth. Emplifi's social media benchmarks provides the relevant dataset context.
Format can inflate the apparent signal
A video may collect many low-friction likes from broad distribution, while a text post attracts fewer but more consequential replies from people who understand the topic. Neither result is automatically better. The business value depends on whether the interaction creates conversation, redistribution, qualified traffic, or future participation.
AI-assisted content adds another complication. Tools can increase publishing volume and help creators adapt content to formats that recommendation systems favor. They can also produce repetitive posts that earn shallow reactions but fail to build recognition, trust, or a reason to return.
For short-form production teams comparing editing workflows, a Klap vs OpusClip comparison offers useful context. The tool choice matters less than the measurement question that follows: did the format attract the right audience, and did those viewers take a meaningful next step?
Detect vanity inflation
Look beyond the headline rate:
- Conversation depth: Count substantive replies and follow-up exchanges, not only one-tap reactions.
- Distribution quality: Check whether new exposure reached relevant prospects, peers, or random viewers.
- Repeat behavior: Watch whether people return to later posts, join threads, or share your ideas.
- Business intent: Pair engagement with profile visits, link clicks, direct messages, or sign-ups where available.
On X, algorithmic inflation often appears as a post that gets broad exposure but little discussion. A smaller post with fast, relevant replies may be healthier for a founder building authority in a niche.
Actionable Strategies to Improve Engagement on X
Improving engagement on X isn't mainly a publishing-volume problem. It's a timing and participation problem. The account has to enter useful conversations while people are still forming opinions, then give readers a reason to add their own experience.

Start with early reply velocity
Treat the first response window as a distribution test. Publish a clear idea, then stay available to answer objections, expand examples, and ask precise follow-up questions. A reply that adds a counterexample is more useful than “Great post,” and it gives the original author or other readers something concrete to respond to.
Use a simple operating routine:
- Prepare responses before publishing. List likely objections, implementation questions, and adjacent examples.
- Monitor relevant conversations. Prioritize posts from creators, operators, and customers whose audiences overlap with yours.
- Reply with an original contribution. Add a method, observation, or useful disagreement instead of repeating the post.
- Continue the thread. Answer the second question, acknowledge corrections, and connect related comments.
- Record the result. Note which topics generated discussion rather than only counting reactions.
Enter high-signal threads
Large accounts attract attention, but not every popular thread is worth joining. Look for conversations where the author is responding, the topic matches your expertise, and readers are asking questions you can answer. A concise technical example can outperform a generic opinion because it gives the thread a new handle for discussion.
Niche trend analysis helps you act before a topic becomes crowded. Search for recurring questions, emerging terminology, and early posts from credible practitioners. Don't chase every trend. Choose discussions where your experience gives you a defensible contribution.
Use assistance without outsourcing judgment
AI can scan timelines, surface relevant conversations, and suggest replies in a consistent voice. You still need to check the claim, tone, timing, and context before posting. Automated replies that ignore the original conversation may create activity, but they weaken trust and can make the account sound interchangeable.
XBurst combines X analytics for impressions, likes, replies, and engagement rates with timeline scanning, on-brand reply generation, creator monitoring, niche trend analysis, scheduling, and follower-management workflows. Use those features to reduce monitoring and drafting work, while keeping the final editorial decision human.
Tracking Growth with Dashboards and Analytics
A dashboard should help you decide what to do next. If it only reports a blended engagement rate, it's a scoreboard, not a growth system.
Start with a fixed measurement layer. For each post, store the formula, publication time, format, topic, impressions or reach, interactions by type, replies received, profile visits, and clicks where available. Keep original posts, replies, reposts, and threads in separate groups. Mixing them can make a highly active reply strategy look like a weak publishing strategy, or the reverse.
Pair the rate with behavior
Use the percentage as a diagnostic signal, then inspect the behaviors beneath it:
- Reply velocity: How quickly did meaningful replies arrive after publication?
- Thread participation: Did people ask follow-up questions or return to the conversation?
- Creator-network proximity: Did trusted accounts or adjacent experts interact?
- Audience movement: Did engaged users follow, unfollow, revisit, or message?
- Content efficiency: Which topics created discussion without requiring excessive posting?
Follower and unfollower counts are useful context, but they shouldn't replace interaction quality. A growing audience that never replies may be less valuable than a smaller network that shares expertise, challenges your ideas, and introduces your account to relevant people.
Build a review rhythm
A daily check should focus on recent posts and open conversations. A weekly review should compare topics, formats, and interaction types. A longer reporting window should identify whether the account is building repeat participation or relying on isolated spikes.
Keep the dashboard operational. Flag posts with unusually fast replies, high-quality quote posts, or strong click intent. Then turn those observations into the next content brief. TheContentMap's editorial metrics guide provides useful context for separating output measures from metrics that support editorial decisions.
Don't average everything into one number too early. Segment by audience, format, and purpose first. Normalize the comparison, then decide whether the issue is the idea, packaging, distribution, response speed, or measurement itself.
Building a Sustainable Engagement Loop
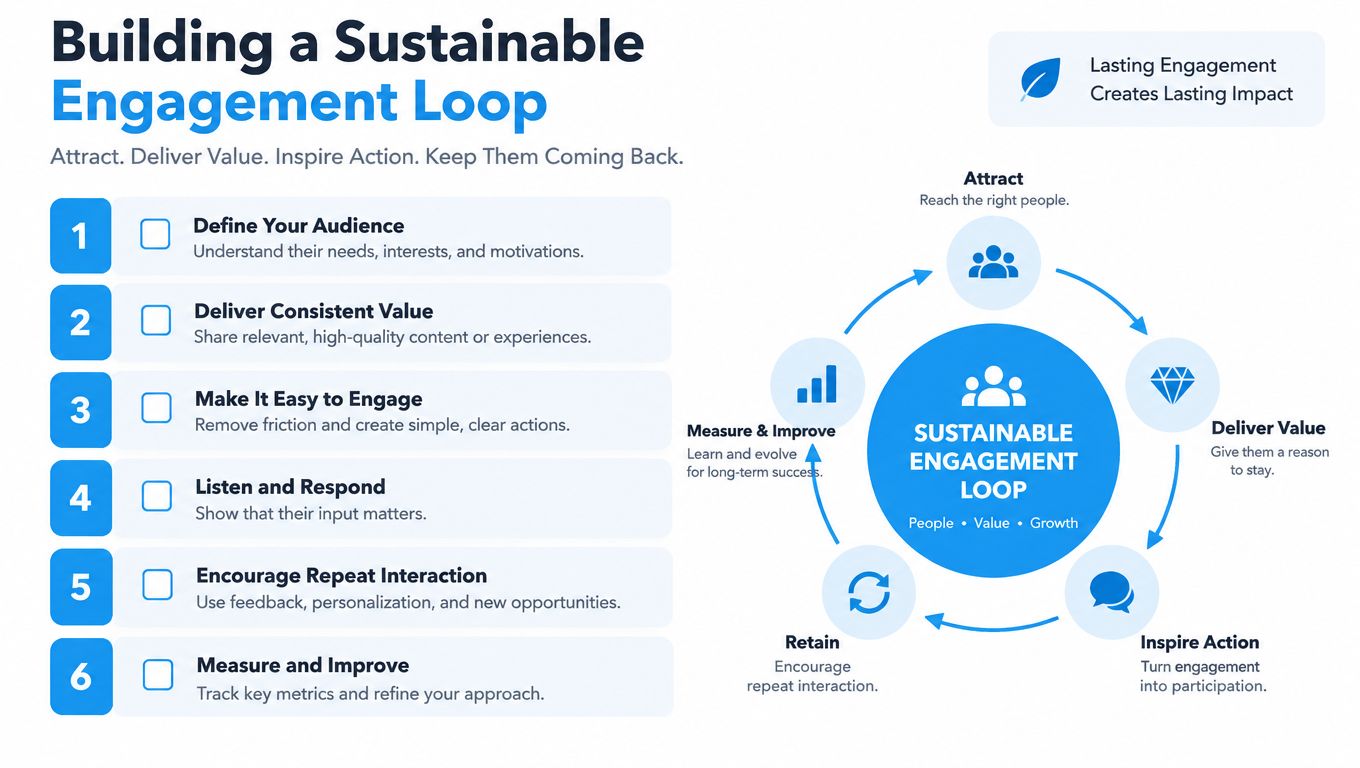
Sustainable growth comes from a loop, not a benchmark. You publish an idea for a defined audience, place it in the right conversations, respond while interest is active, study the resulting behavior, and use that learning to improve the next idea.
The social media engagement rate belongs in the middle of that loop. It can tell you whether interaction changed relative to a consistent denominator, but it can't explain why. A rate may fall because reach expanded, because the topic missed the audience, because the format changed, or because the dashboard counted interactions differently.
Use this operating checklist
- Define the denominator: Write whether your X rate uses followers, reach, impressions, or another base.
- Separate interaction types: Distinguish likes from replies, reposts, quote posts, and clicks.
- Normalize comparisons: Compare the same platform, audience context, format, and reporting window.
- Prioritize early conversation: Review reply velocity and thread depth, not only final totals.
- Study audience quality: Check whether interaction comes from relevant people who return and participate.
- Feed the next brief: Turn recurring questions, objections, and high-signal discussions into content ideas.
The loop becomes durable when every metric changes a decision. If a rate rises but replies become shallow, investigate distribution quality. If the rate stays modest while the same knowledgeable people return to your threads, protect that community signal. If a post earns attention but no meaningful action, improve the bridge between the idea and the next step.
Stop asking whether your X percentage can match a TikTok or Instagram benchmark. Ask whether your measurement is consistent, whether the right people are responding, and whether each conversation makes the next post more relevant.
XBurst helps creators, founders, and brands monitor X impressions, likes, replies, and engagement rates while finding high-opportunity conversations and drafting on-brand responses. Use XBurst to turn early reply velocity and platform-specific analytics into a repeatable X growth workflow.