
Twitter Growth Analytics How to Measure and Scale
Master twitter growth analytics to measure engagement, track followers, and turn insights into content that scales your X audience faster.

You publish consistently on X, watch the follower count, and still can't explain why one post attracts replies while another disappears. A viral thread may bring a rush of attention, yet leave your profile with little lasting momentum. Meanwhile, a modest post that earns thoughtful replies or qualified site visits may create more value than a much larger impression total.
Twitter growth analytics gives you a way to distinguish those outcomes. It treats growth as a system of velocity, engagement quality, retention, and attribution, rather than a scoreboard built around followers alone. That shift matters for creators, founders, and social managers who need to decide what to publish, whom to engage, and whether X activity contributes to a wider business goal.
By the end, you'll have a practical method for reading X data, separating a temporary spike from a durable trend, choosing useful benchmarks, and reporting progress in language other people can act on. The aim isn't to collect more metrics. It's to make better growth decisions with the metrics you already have.
Introduction to Twitter Growth Analytics That Actually Drives Growth
A creator might publish a thread on Monday, a product opinion on Tuesday, and several replies throughout the week. On Friday, the account has gained followers, but the creator doesn't know which activity caused the change. Was it the thread, a reply from a larger account, a timely topic, or simple chance?
That uncertainty leads to predictable mistakes. The creator repeats the format with the highest impression count, posts more often without checking audience response, and treats every follower increase as proof that the strategy works. A founder may do the opposite, abandoning useful educational content because it attracts fewer likes than a broad opinion post.
A better approach starts with a simple question: what changed, for whom, and what happened next? Native analytics can show on-platform activity, but growth analysis becomes useful only when you connect the signals to decisions. The data-driven Twitter marketing tactics approach is valuable for the same reason, it turns observations into repeatable actions instead of isolated content guesses.
Followers are an outcome, not a diagnosis
Follower count tells you the size of the audience at a moment in time. It doesn't tell you whether new followers stay, whether they match your intended audience, or whether they take meaningful actions after following.
Think of an account as a bucket. Velocity measures how quickly water enters. Retention shows whether the bucket keeps it. Attribution tells you whether that water came from a useful source or from a brief storm. You need all three views before deciding whether the system is healthy.
This guide builds that system progressively. You'll first learn how to interpret reach and activity rates, then how to benchmark performance without misleading comparisons. Finally, you'll turn those findings into content experiments, engagement routines, dashboards, and business reporting.
For a solo creator, that may mean finding the topics that generate genuine conversation. For a founder, it may mean identifying which posts lead people toward a product conversation. For a social manager, it means giving stakeholders a clear explanation of movement, not a screenshot full of disconnected numbers.
What Twitter Growth Analytics Means Today
Early X growth made raw scale difficult to interpret. Twitter passed 100 million monthly active users in 2012, then reached roughly 140 million users by March 2012 while processing about 340 million tweets per day, according to the historical Twitter statistics overview. By 2010, the platform was already handling about 50 million tweets per day from more than 180 million registered accounts, which helps explain why activity rates became more informative than account totals.
The platform's current growth context is different. Independent estimates put X at about 561 million monthly active users in July 2025, down from around 586 million in July 2024, while other estimates place global monthly active users between roughly 570 million and 611 million. The same X audience and trends analysis reports that the platform reached 21% of adults in the United States, unchanged year over year and down from 23% in 2021. These figures point toward a more mature, uneven environment where audience quality and engagement efficiency deserve close attention.
Think like a fitness tracker
A single weigh-in tells you your weight. A fitness tracker gives you a richer picture, including movement, habits, consistency, and changes over time. X analytics works the same way. One post's impressions are a snapshot, while a sequence of posts reveals whether your distribution and audience response are improving.
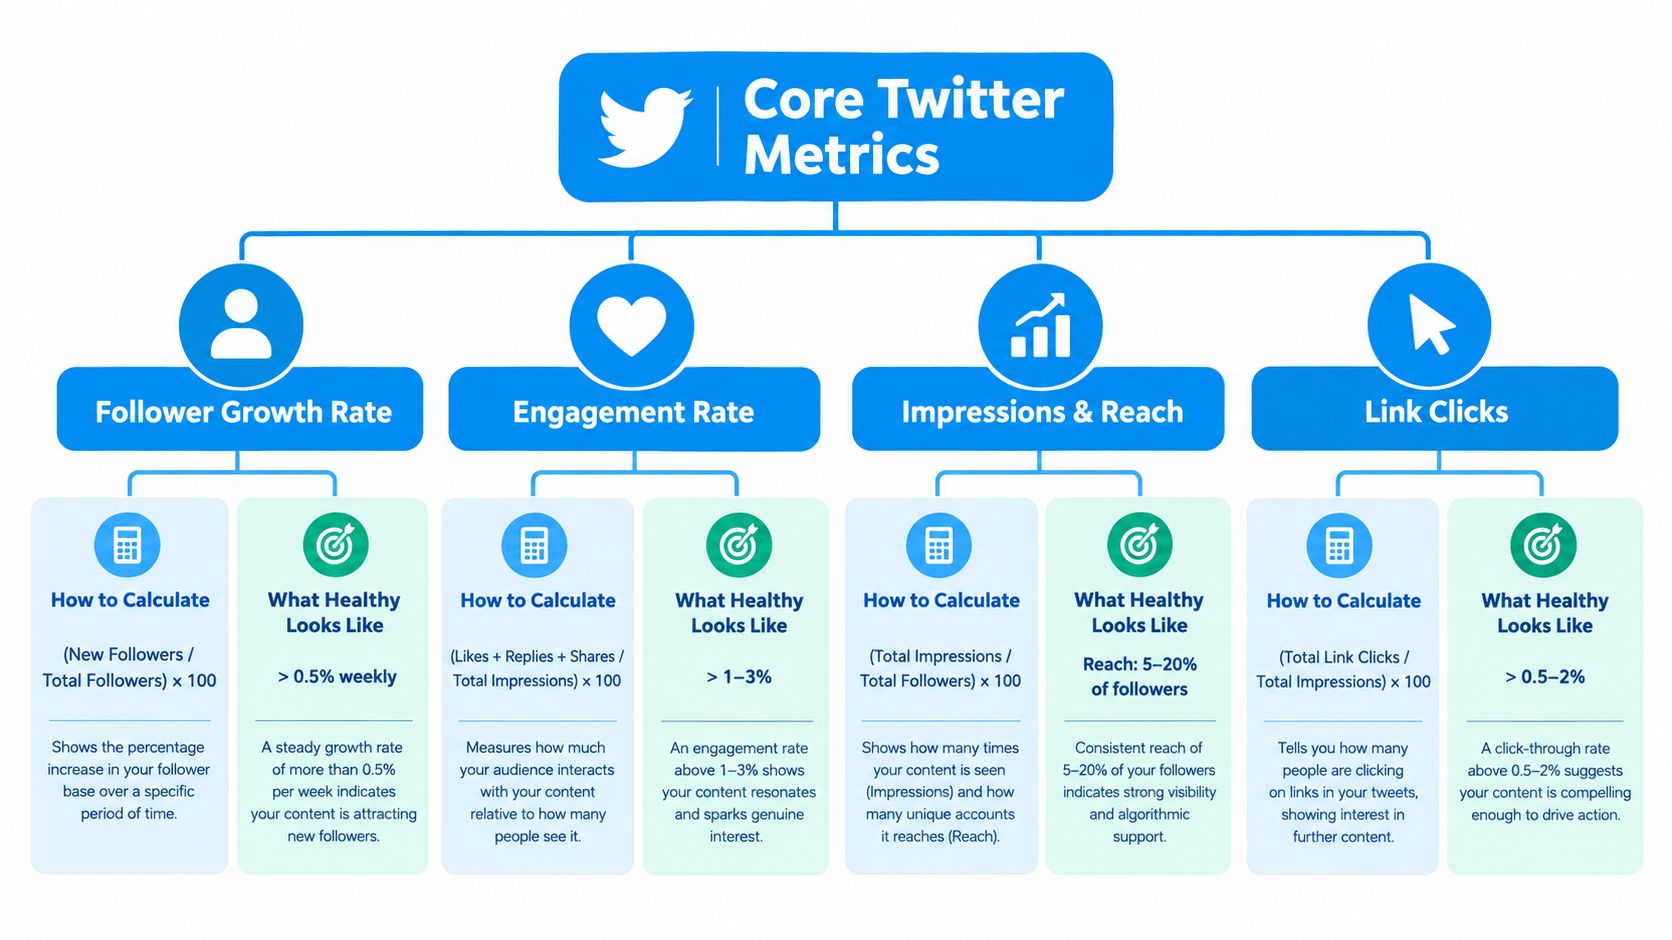
Use four signal groups:
- Reach signals show how widely content travels, including impressions and, where available, reach.
- Resonance signals show whether people respond, such as replies, reposts, likes, and engagement rate.
- Velocity signals show the pace of change, including follower gains and activity over a defined period.
- Retention signals show whether attention compounds, including net follower movement, returning engagement, and audience quality over time.
Daily posting volume and event-driven spikes make rate-based analysis especially important. A major conversation can inflate impressions for a short period. Comparing that post with your normal baseline helps you decide whether it created a repeatable pattern or benefited from timing.
The practical mental model is a health dashboard. Reach is circulation, engagement is response, velocity is movement, and retention is staying power. None is sufficient by itself, but together they explain how an account grows.
Key Twitter Growth Metrics and How to Interpret Them
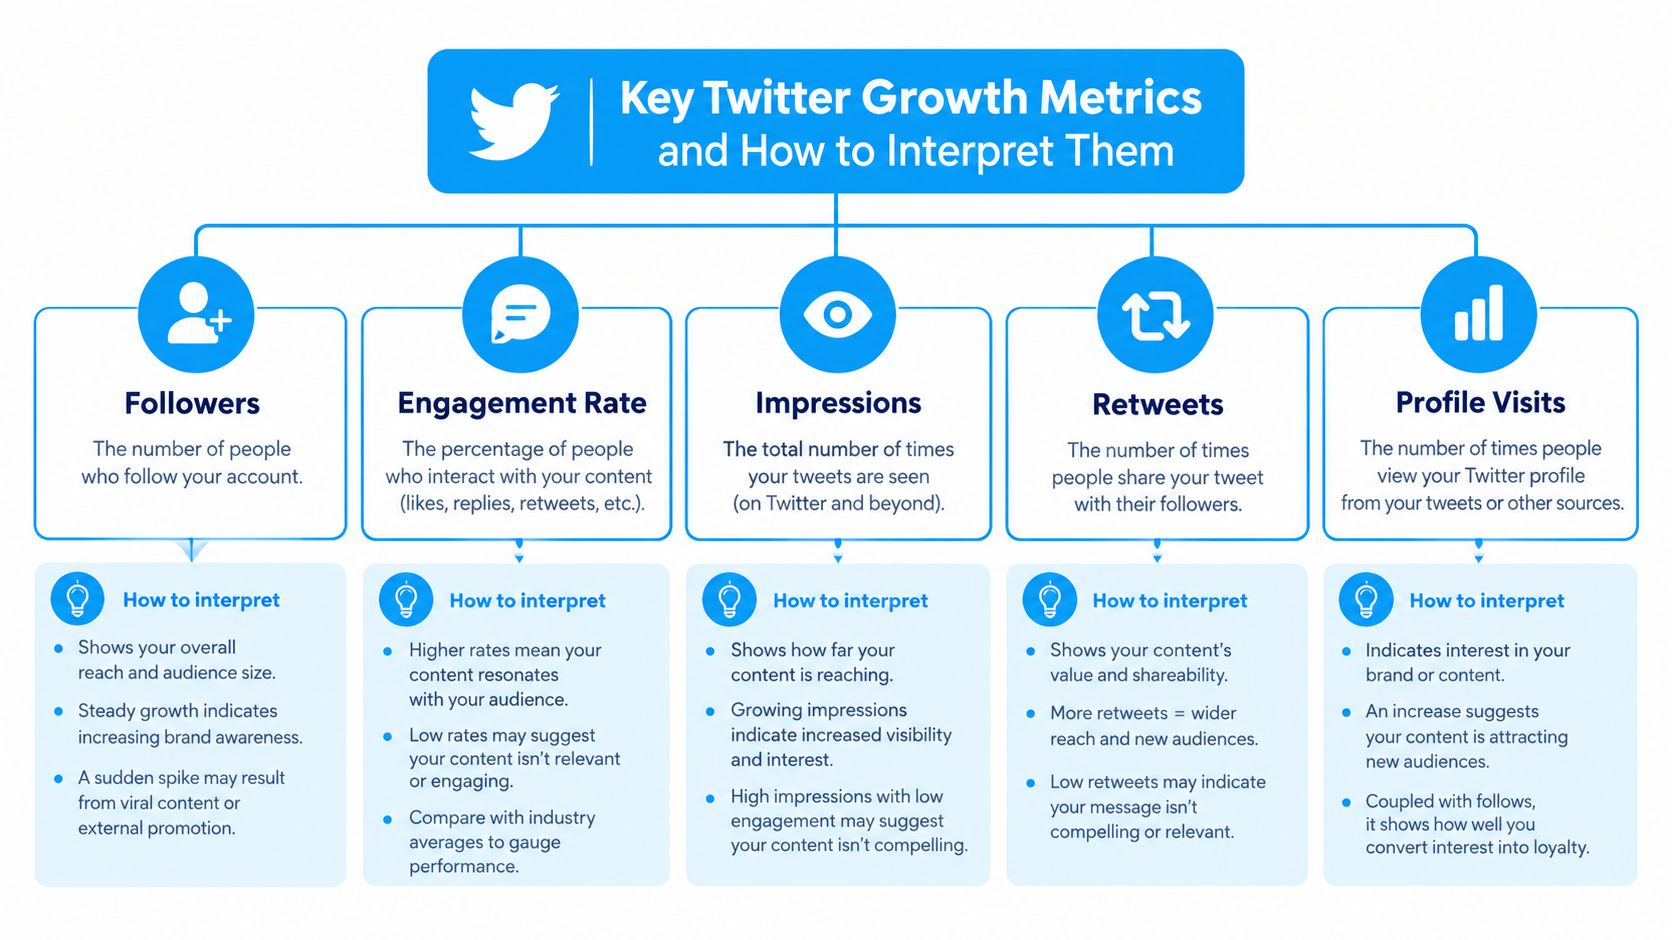
Metrics become useful when each one answers a different question. Impressions ask whether X distributed the content. Engagement asks whether people reacted. Profile visits and clicks ask whether interest moved deeper. Follower changes ask whether that interest became an audience relationship.
Distribution and attention
Impressions count how often content appeared, while reach refers to the number of distinct people exposed to it when that data is available. Neither metric proves that people understood, trusted, or acted on the post. A high impression total can come from repeated exposure, a large conversation, or a timely topic.
Practical rule: Treat impressions as the size of the opportunity, not the value created.
Compare impressions with profile visits, replies, reposts, and link clicks. If impressions rise but deeper actions stay flat, distribution improved without a corresponding improvement in message relevance. If impressions are modest but profile visits and qualified clicks increase, the post may be efficient even without broad exposure.
Engagement and conversation
Engagement rate places interactions in relation to exposure or another defined base. The exact denominator can vary by tool, so record your method and use it consistently. A simple version is:
Engagement rate = total engagements ÷ impressions × 100
Likes can indicate quick approval, while replies reveal conversation. Reposts expand distribution through other accounts. Detail expansions and profile visits can indicate curiosity, but they don't carry the same meaning as a reply or a click to a relevant page.
The Twitter engagement rate calculation guide can help standardize the formula you use. Don't compare rates across unlike formats without context. A question designed to generate replies should be judged differently from a product announcement designed to generate clicks.
Audience movement and intent
Follower growth rate measures audience change relative to the account's starting audience:
Follower growth rate = net new followers ÷ starting followers × 100
Track both new followers and unfollows when possible. Net growth can hide churn. An account may gain attention from a viral post and lose a portion of people who followed for a topic it doesn't regularly cover.
Profile visits sit between awareness and commitment. Link clicks indicate a stronger form of intent because the person chose to leave X or explore an offer. Use tagged links and conversion tracking on your site so you can connect the click with later behavior. X's native view shows what happened on the platform, not the complete customer journey.
Video and audience quality
For video, views are only the opening signal. Completion, repeat viewing, and the actions that follow provide a better reading of whether the content held attention. A short clip can earn views through autoplay without creating meaningful interest.
Audience quality is harder to reduce to one number. Review whether new followers fit your niche, participate in relevant conversations, and respond to later posts. A smaller audience that returns and acts can be more valuable than a larger audience acquired through an unrelated spike.
How to Measure Performance and Benchmark Your Growth
A reliable review follows the same sequence each week. Consistency matters more than complexity because changing the method every time makes ordinary variation look like a strategic shift.
Build a clean measurement routine
Start by exporting or recording account and post-level data from the X analytics views available to you. Add publication date, format, topic, call to action, impressions, engagements, replies, reposts, profile visits, clicks, and follower movement. Keep a separate note for unusual events, such as a mention from a large account or a major news cycle.
Next, normalize the comparison. Group posts by format and purpose, then compare similar content with similar content. A promotional post shouldn't compete directly with a community question, and a reply shouldn't be judged by the same expectation as a standalone thread.
Use rolling averages to reduce noise. A single post can be unusually strong or weak. A moving average helps reveal whether the typical result is changing. Track short, medium, and long windows, such as 7, 30, and 90 days, and label those periods clearly in your sheet or dashboard.
Separate the spike from the baseline
When a post performs far above normal, mark it as an event rather than immediately treating it as a new standard. Ask:
- Did the account gain followers that remained active afterward?
- Did the topic fit the account's recurring subject area?
- Did profile visits, replies, or clicks rise with impressions?
- Did later posts retain any of the increased attention?
A spike is useful if it reveals a repeatable topic, format, or distribution path. It isn't proof of compounding growth until later performance supports that interpretation.
Use stage-appropriate benchmarks
Benchmarks should come from your own recent baseline and from comparable accounts in the same niche. Avoid treating an account with a small, focused audience as underperforming just because a much larger account receives more total interactions.
| Account Stage | Engagement Rate | Weekly Follower Growth | Signal to Watch |
|---|---|---|---|
| Early account | Establish a consistent baseline | Track direction rather than a universal target | Which topics earn qualified replies |
| Growing account | Compare format-level rates | Separate steady gains from spikes | Whether new followers return |
| Established account | Monitor efficiency by audience segment | Watch net movement and churn | Whether reach still produces intent |
The table intentionally avoids universal targets. Without verified account, niche, and format context, a fixed “healthy” rate can mislead. If the reporting workload is large, a resource on AI automation for social media may help teams organize recurring collection and review tasks, but automation should preserve the definitions behind each metric.
Turning Analytics Into Content and Engagement Tactics
Analysis earns its place only when it changes what you do next. Suppose your posts about a narrow product problem generate replies from the people you want to reach, while broad motivational posts produce likes but little profile activity. The conclusion isn't just to publish more product content. The stronger hypothesis is that specific problems create a clearer reason for the right audience to respond.
Convert patterns into hypotheses
Write each insight as a testable statement:
- Topic hypothesis: Specific implementation problems attract more qualified conversation than general commentary.
- Format hypothesis: A short sequence may create more profile exploration than a single claim.
- Engagement hypothesis: Replies to active niche discussions may introduce the account to relevant people before publishing another standalone post.
- Timing hypothesis: Certain audience routines may create stronger early response, but the pattern must survive repeated tests.
Run one meaningful change at a time. Keep the topic constant while changing the format, or keep the format constant while changing the call to action. Otherwise, you won't know which variable produced the result.
Build around audience behavior
Use replies as research, not as a mechanical growth tactic. A thoughtful response can clarify a problem, add a useful example, or challenge an assumption without forcing a promotion. Track whether reply-led activity creates profile visits, relevant followers, and later conversations.
Threads can support education when each post advances one idea. End with a clear next step, such as a question or a practical summary, rather than adding length for its own sake. Standalone posts work well for sharp observations, while links need enough context to earn the click.
The most useful content calendar balances three jobs:
- Discovery content attracts people through timely ideas and niche conversations.
- Trust content demonstrates a point of view through explanations, examples, and replies.
- Action content gives interested readers a relevant path to learn, subscribe, or speak with you.
Use tools inside the learning loop
Scheduling can protect consistency, but it shouldn't replace live participation. Trend monitoring can surface conversations early, while style analysis can help keep assisted drafts aligned with an established voice. Use those capabilities to increase the number of informed decisions, not to publish generic replies at scale.
XBurst is one option for this workflow. Its profile analysis, engagement analytics, follower and unfollower tracking, reply opportunity discovery, style analysis, and scheduling features connect measurement with daily actions. The operator still needs to decide whether a conversation fits the account and whether the resulting activity supports the intended audience.
Reporting and Dashboard Best Practices With Real Examples
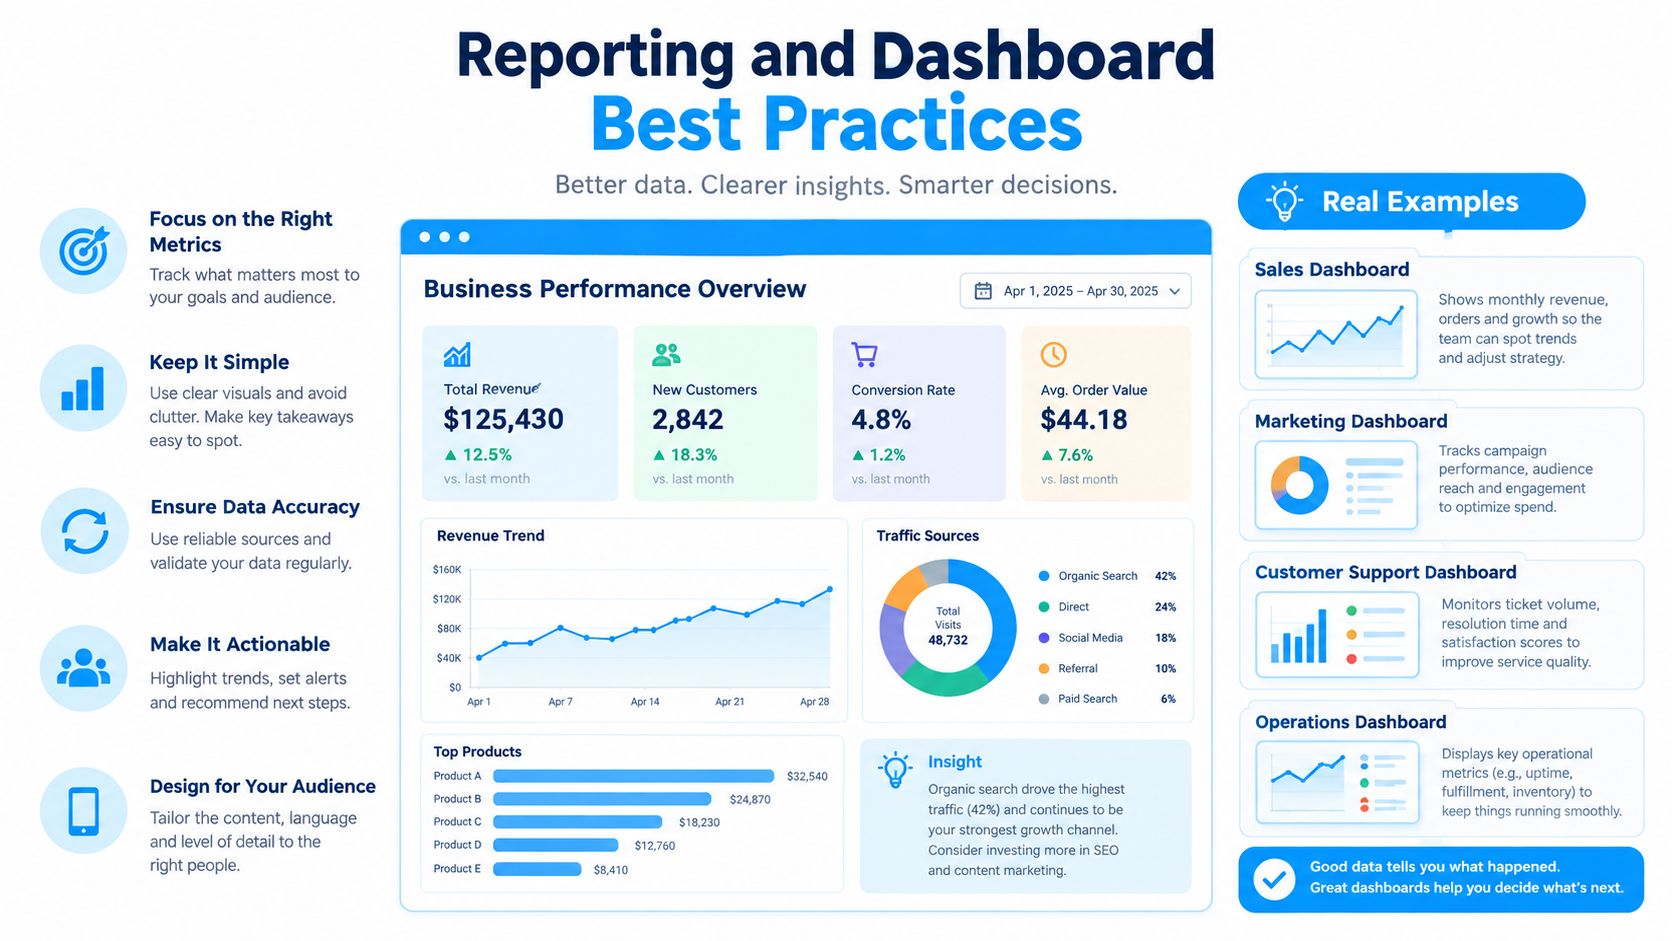
A useful report helps someone choose an action within a few minutes. A native analytics screen can show many values, but it often leaves the reader to decide which movement matters and whether the movement connects to a business objective.
Native analytics versus external tracking
Native X analytics is closest to the source and useful for post-level inspection. It can show impressions, engagements, profile visits, follower changes, and content patterns within the views available to the account. Its weakness is context. It doesn't automatically explain which audience members stayed, how a spike compared with a longer baseline, or whether a click became a business result.
External tracking adds that missing layer. A spreadsheet, data warehouse, social reporting tool, or analytics dashboard can preserve historical snapshots, group posts by campaign, and join X activity with tagged website sessions or leads. Choose the simplest system that answers the decisions your team makes. A broader comparison of top SEO dashboard tools for 2026 can help teams think through dashboard selection, even when their reporting spans more than social data.
Give each reader the right view
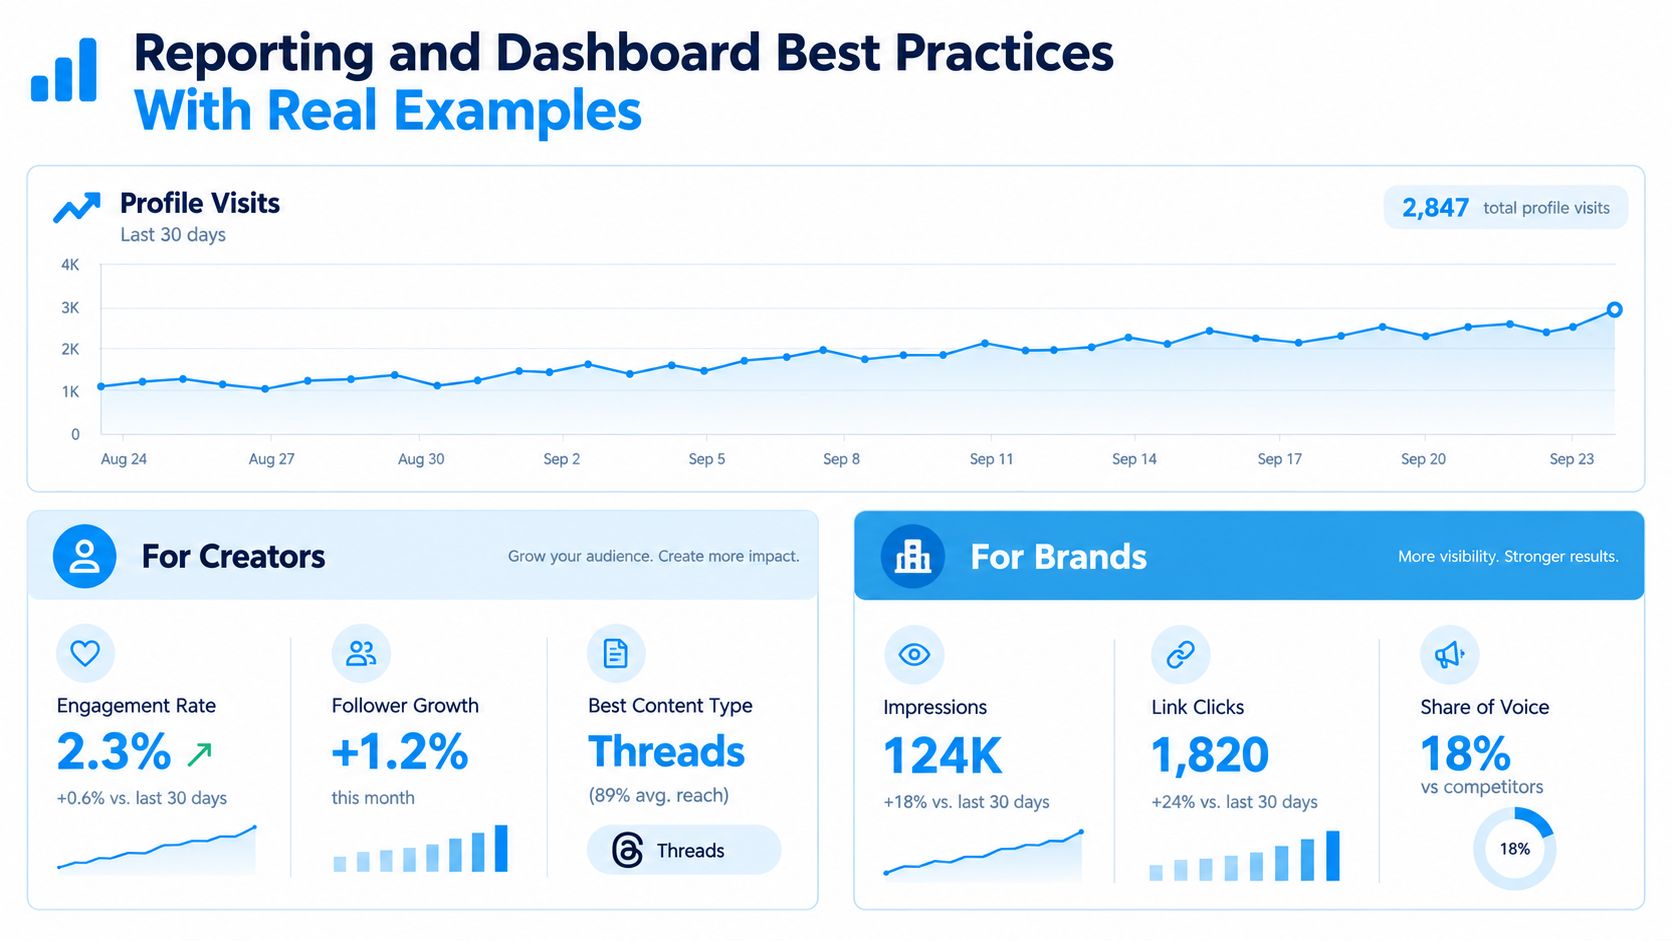
A creator's weekly dashboard might show:
- Audience movement: net followers, new followers, and unfollows.
- Content efficiency: median impressions and engagement rate by format.
- Conversation quality: replies that led to profile visits or meaningful relationships.
- Next experiment: one topic, format, or engagement behavior to test.
A founder's monthly report needs a different emphasis. Show the path from exposure to profile visit, click, signup, inquiry, or another defined business action. Include a short explanation of what changed, why it likely changed, and what the team will do next.
The historical gap deserves explicit treatment. X doesn't preserve follower history by default in a way that answers every churn question, so start recording snapshots before you need to explain a change. Note audience composition when the available data supports it, and annotate unusual events rather than hiding them in an average.
The analytics dashboard examples can provide layout inspiration, but the principle is simple: display trends, definitions, and decisions together. Omit decorative charts, unexplained totals, and metrics that don't map to a goal.
A report should answer three questions: what happened, what caused it, and what will change next.
Your Next Steps for Sustainable Twitter Growth
Sustainable growth becomes easier to read when you stop asking whether the follower count went up and start asking whether the account is gaining the right attention at a repeatable pace.
Use this checklist over the next month:
- Choose one primary outcome: Decide whether you're optimizing for qualified conversation, audience growth, site visits, or another business result.
- Record a baseline: Capture your normal post and account performance before changing the strategy.
- Tag your activity: Label topics, formats, campaigns, replies, and unusual events.
- Review retention: Check whether new followers remain relevant and engaged after the initial attention fades.
- Run one experiment: Change one meaningful variable and define what result would support the hypothesis.
- Report the decision: Write what happened, your interpretation, and the next action in plain language.
Don't chase every viral spike. A spike that produces no relevant followers, returning engagement, or business intent is an event to study, not a strategy to copy. Invest in external tracking when historical churn, cross-channel attribution, or recurring stakeholder reporting matters enough that native snapshots can't answer the question.
Start this week with one metric and one experiment. Measure the result, keep the method consistent, and let the evidence shape the next post.
XBurst helps creators, founders, and teams connect X content and engagement with practical growth signals, including profile analysis, opportunity discovery, scheduling, and follower tracking. Visit XBurst to explore the workflow and start testing a clearer approach to Twitter growth analytics.