
Twitter Follower Growth Rate: 2026 Playbook for Brands
Learn how to track and improve your twitter follower growth rate in 2026 with proven tactics, benchmarks, and metrics that turn followers into real audience
Follower growth rate equals (new followers minus unfollows) divided by starting followers, multiplied by 100. A healthy rate varies by account age and niche, so there isn't one universal target that every Twitter account should chase.
The popular advice says to watch your percentage and push it higher every month. That advice is incomplete. A growth rate is useful, but only when you read it alongside the size of the platform, your impressions, the quality of new followers, and the number of people who leave.
An account can gain followers while losing reach. Another can grow slowly while attracting people who read, reply, return, and eventually become customers. The number matters, but the diagnosis matters more.
Why Your Growth Number Lies to You
A single follower percentage doesn't tell you whether your content improved. It combines several forces: how often people discovered your posts, how compelling those posts were, how many followers stayed, and how large the reachable audience was during the period.
Consider a creator who gains followers quickly after one post travels beyond their usual audience. The next month, growth slows, but profile visits still convert well and returning readers reply to new posts. The headline number looks weaker, while the underlying relationship with the audience may be stronger.

Platform expansion changes the denominator
Twitter's own history shows why account growth needs context. In May 2011, 13% of U.S. online adults reported using Twitter, compared with 8% in November 2010, while usage among adults aged 25 to 34 rose from 9% to 19% and usage among adults aged 30 to 49 increased from 7% to 14%, according to Pew Research's 2011 Twitter update.
Those figures describe audience adoption, not individual account growth. They still establish an important principle: creators had a larger stream of new potential followers entering the network during a rapid expansion period.
Today, a slower rate doesn't automatically mean your posts became less useful. Recent third-party estimates place X's global monthly audience at roughly 550 million to 561 million, while independently measured mobile daily users reportedly fell 11.9% year over year in January 2026, according to SocialPilot's X statistics overview. These estimates differ, so treat them as context rather than a precise platform census.
Practical rule: Treat follower growth as a signal that needs supporting evidence, not as a final grade.
Replace the single-score mindset
Record follower growth with impressions, profile visits, follow conversion, unfollows, and repeat engagement. If the rate rises because of a broad viral post but few new followers return, you gained exposure without necessarily building durable demand.
The opposite pattern can also be healthy. Lower reach paired with thoughtful replies, repeat interactions, and relevant profile visits may indicate a more concentrated audience. For a founder, consultant, or specialist, that audience can be more useful than a large group that never engages.
How to Calculate Follower Growth Rate Correctly
Start with the net change, not the number of new follows shown in isolation. The basic calculation is:
Follower growth rate = (new followers minus unfollows) ÷ starting followers × 100
The starting follower count is the total at the beginning of the chosen period. New followers are gross additions. Unfollows are people who left. Subtracting unfollows gives you net new followers, the number that represents the account's actual change.
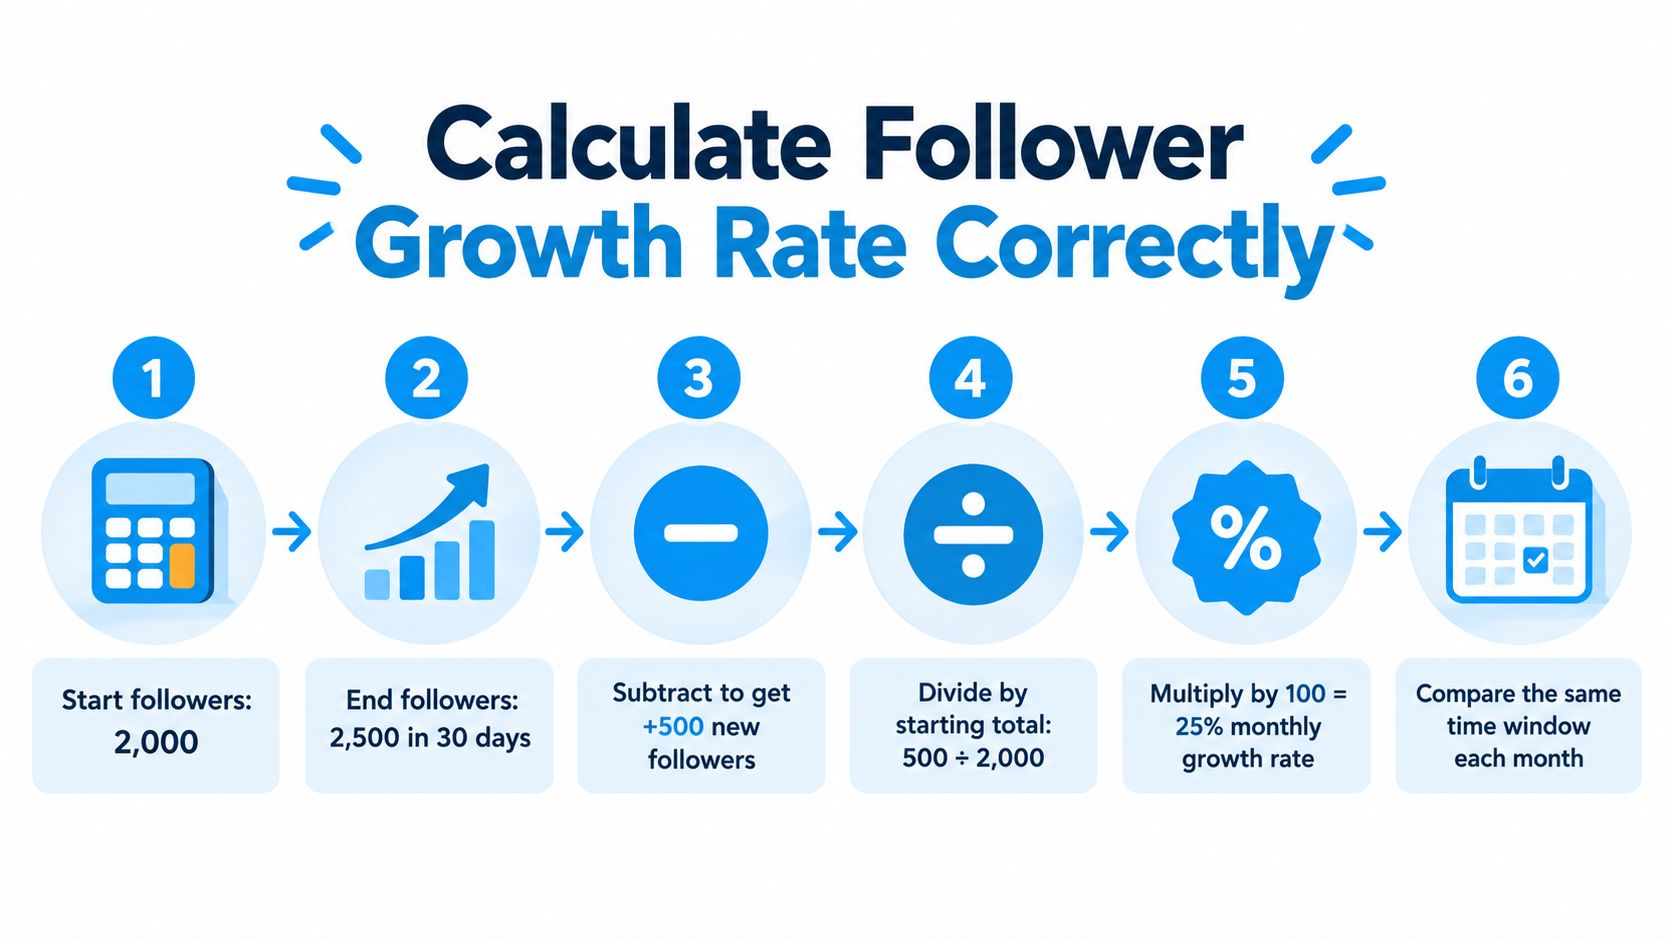
Work through the arithmetic
Suppose an account starts a 30-day period with 2,000 followers and ends with 2,500 followers.
- Subtract the starting count from the ending count: 2,500 minus 2,000 equals 500 net new followers.
- Divide the net gain by the starting count: 500 ÷ 2,000 equals 0.25.
- Multiply by 100: 0.25 × 100 equals a 25% monthly growth rate.
That example uses the net change visible in the account total. If analytics also show gross follows and unfollows, use them to explain the result. For instance, a net gain of 500 could come from 600 new follows and 100 unfollows, or from 900 new follows and 400 unfollows. Both produce the same rate, but the second account has more churn to investigate.
For another platform, the same reasoning applies when you find your Instagram growth rate. The formula is portable, but the reporting windows and available analytics can differ.
Keep the time window consistent
A monthly rate compares one month with another. A weekly rate compares equal seven-day periods. Don't compare a short launch spike with a full calendar month, because the longer period has more time to accumulate both follows and unfollows.
For a deeper count-based workflow, use Twitter follower counts as a reference point, then record the start date, end date, starting total, ending total, gross follows, and unfollows in the same sheet.
What Healthy Growth Looks Like by Account Size and Niche
There isn't a universal healthy Twitter follower growth rate because the percentage changes meaning as the account gets larger. An early account can add a modest number of people and still show a large percentage increase. An established account may add many more people in absolute terms while displaying a smaller percentage.
A simple comparison makes the base effect clear. Adding 500 followers to an account with 2,000 followers produces a much larger percentage than adding 500 to an account with 20,000. The work may be similar, but the denominator changes the story.
Use account stage as a reference
Early-stage accounts often experience sharper percentage movement because each successful post affects a small base. Established accounts usually need to evaluate net additions, retention, and qualified engagement alongside the rate. A lower percentage can coexist with stronger brand visibility and a larger flow of relevant conversations.
Twitter's historical platform projections show the same pattern at network level. Forecasts cited by eMarketer projected global user growth of 50% in 2012, 30% in 2013, and 24.4% in 2014, with the global user base estimated at 227.5 million in 2014, 269.6 million in 2015, and 387 million by 2018. U.S. projected growth was expected to slow from 19% in 2014 to 9% in 2015, as reported by Search Engine Journal.
Those are platform projections, not account benchmarks. They illustrate why percentage growth commonly slows as a base expands.
Let the niche set the quality standard
Entertainment accounts can attract broad discovery, while B2B and expert accounts may grow more deliberately around a narrower audience. A specialist should ask whether new followers understand the subject, respond to relevant posts, and return for future discussions.
Posting frequency, geography, format, and distribution also change the comparison. A daily educational account aimed at one professional market shouldn't judge itself against a global entertainment profile publishing highly shareable material.
Use the growth stage calculator to frame the account's stage, then compare your current rate with your own recent baseline. A useful benchmark is not merely “faster than another account.” It's more qualified growth than your previous period under comparable conditions.
Two Real Growth Scenarios That Reveal What Numbers Mean
Two accounts can report the same growth rate and have entirely different business outcomes. The difference appears when you inspect the path behind the percentage.

Scenario one focuses on acquisition
A creator posts a controversial opinion that spreads beyond the usual audience. New follows rise sharply during the month, producing a strong headline growth rate. Yet average impressions on later posts fall, few new followers reply, and many of the new accounts disappear from the conversation.
This account may have improved discovery without improving retention. The next action isn't necessarily to publish more controversial posts. The creator should identify which topic and audience produced the relevant follows, then test whether educational follow-up posts generate profile visits and repeat engagement.
Scenario two builds a smaller relationship base
A niche expert grows at the same rate through consistent posts and replies in a focused professional community. The account receives fewer broad impressions, but profile visitors convert steadily, replies address the expert's subject, and the same people return to later discussions.
The slower-looking account has stronger evidence of audience quality. Its followers aren't merely passing through. They're forming a repeat audience around a clear point of view.
| Signal | Acquisition-heavy pattern | Relationship-led pattern |
|---|---|---|
| Follower rate | Strong headline increase | More measured increase |
| Impressions | Can weaken after the spike | May remain narrower |
| Replies | Irregular or low relevance | Specific and recurring |
| Next decision | Improve retention and qualification | Deepen useful content |
The point isn't to dismiss fast growth. Fast growth can be valuable when new followers stay active and match the account's purpose. Read the percentage with the behavior that follows it.
How to Track Follower Growth as Part of a Full Measurement System
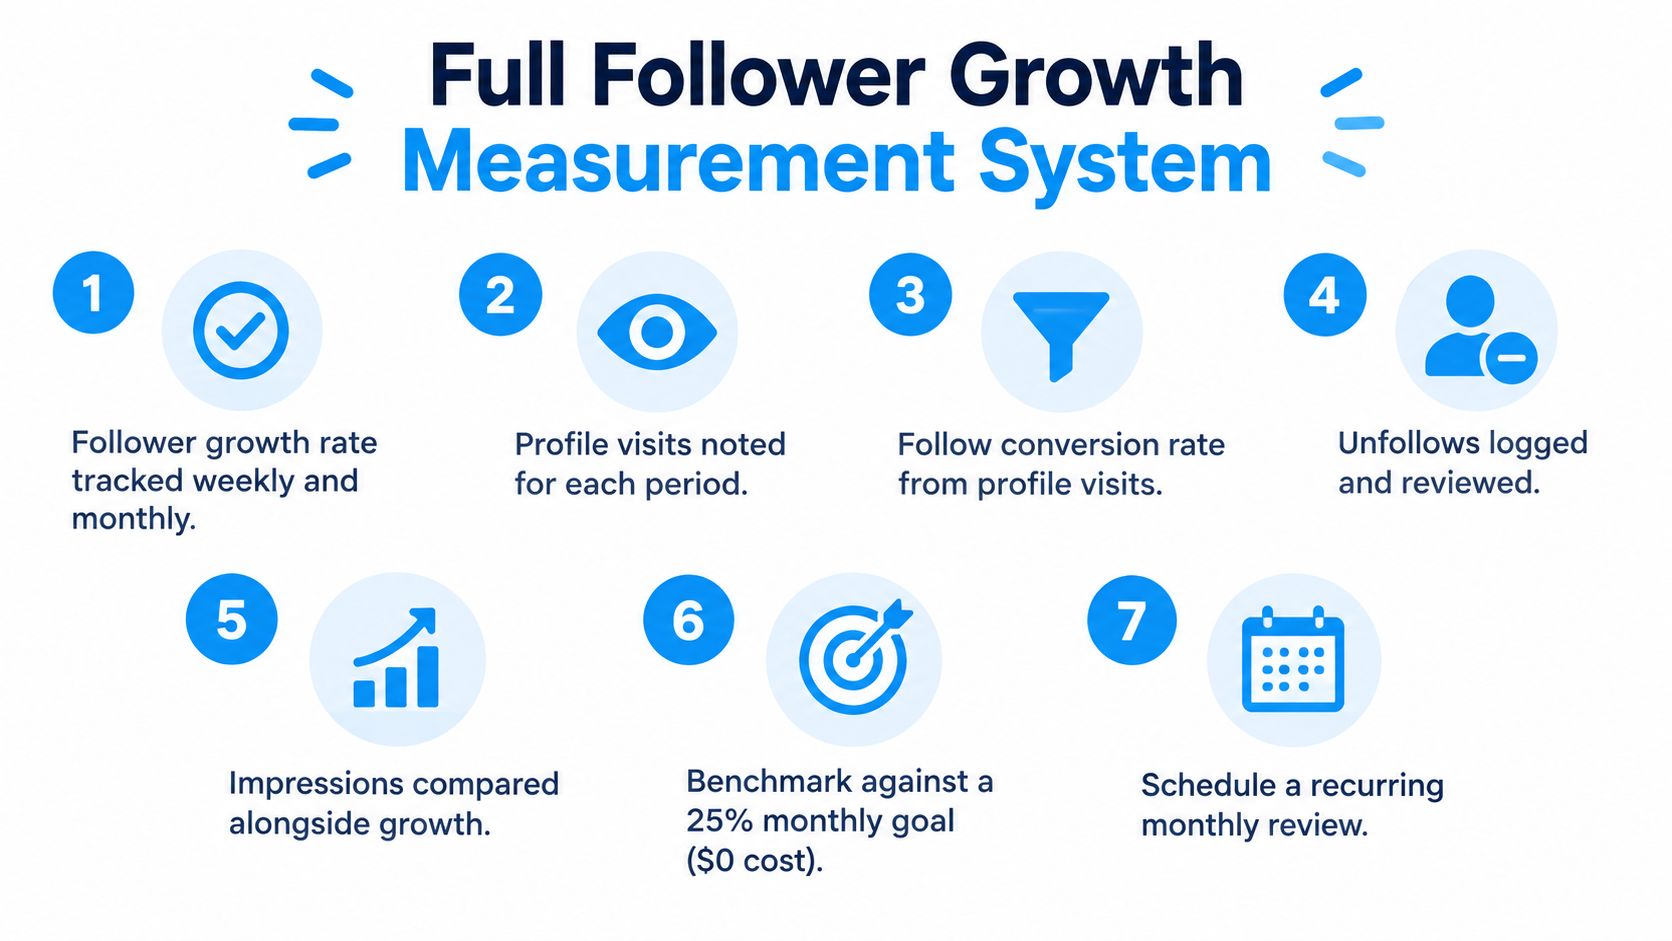
Follower growth belongs in a small measurement system, not on a dashboard by itself. Track the rate with profile visits, follow conversion, unfollows, impressions, and returning-engager behavior so you can tell whether discovery is becoming an audience.
A practical routine starts with one consistent period. Record the opening follower total, closing total, gross follows, unfollows, impressions, profile visits, and meaningful interactions. Calculate the rate, then compare it with the other movements rather than interpreting the result in isolation.
Read combinations, not isolated metrics
- Growth rises while impressions fall: Review whether a small number of posts created efficient profile conversion, or whether the account is losing broad discovery.
- Growth rises while unfollows also rise: Inspect the promise made by the posts that attracted people. The content may be attracting curiosity without setting accurate expectations.
- Growth slows while replies become more relevant: The account may be reaching a narrower but more valuable audience.
- Profile visits rise while follows stay flat: Improve the bio, pinned post, and profile promise before changing the entire content strategy.
- Impressions rise while engagement weakens: Reach expanded, but the message may not match the people seeing it.
A large post dataset reported average impressions declining from 2,864.78 in 2024 to 2,711.29 in 2025, while average likes, reposts, and replies increased, according to Sprout Social's Twitter statistics. That pattern shows why reach and interaction can move in opposite directions.
Keep denominators visible
Engagement comparisons become misleading when one report uses impressions and another uses followers. The same source cites a median brand engagement rate near 0.015%, influencer engagement around 0.39%, and a follower-based median near 0.03%. Those figures use different populations and denominators, so don't place them in one ranking as if they measured the same thing.
For a broader framework, review guidance on measuring creator campaign performance, then label each metric by its denominator. Your dashboard should make it obvious whether a rate uses impressions, followers, profile visits, or another base.
Using an Analytics and Growth Tool to Improve Growth Decisions
A measurement routine fails when collecting the numbers takes so much effort that nobody reviews them consistently. An analytics and growth tool can centralize follower movement, content performance, engagement signals, and scheduling, turning a percentage into a decision prompt.
The useful question isn't whether a platform displays growth. Most dashboards can show a count. The useful question is whether the tool helps you connect a change in followers to the posts, conversations, timing, and audience segments that preceded it.
Choose workflow features carefully
Look for a system that can:
- Track net movement: Separate follows, unfollows, and net growth so churn doesn't disappear inside a total.
- Compare periods: Review short and longer windows without mixing their denominators.
- Connect content to outcomes: See whether posts generate impressions, profile visits, replies, or follows.
- Surface relevant conversations: Find opportunities to participate in discussions where the audience already cares about your niche.
- Support consistent publishing: Schedule content without removing the need for real replies and community participation.
XBurst is one option that combines follower and unfollower tracking with visualized growth over 7-, 30-, or 90-day periods, including follows, unfollows, and net growth, according to the publisher's product information. It also provides engagement analytics, niche trend analysis, writing support, conversation discovery, and scheduling in a workflow designed for X.
Turn reports into experiments
Use the tool to identify a change, not to admire a chart. If profile visits rise after thoughtful replies but original posts produce weak conversion, allocate more time to high-context conversations and improve the profile destination. If unfollows cluster after promotional posts, test clearer education before the offer.
A weekly review can flag immediate changes, while a monthly review gives the account enough time to distinguish a temporary spike from a sustained pattern. The tool reduces manual work, but the strategic decision still belongs to the creator or team.
For a closer look at the role these systems play, see this guide to a social media analytics platform. The principle remains simple: collect fewer disconnected numbers and make more decisions from connected signals.
Common Follower Growth Tracking Mistakes and How to Fix Them
Most tracking errors come from using a correct formula with incomplete inputs. Audit the process before changing the content strategy.
| Mistake | Why it misleads you | Better practice |
|---|---|---|
| Counting new follows only | It hides churn and overstates retention | Subtract unfollows to calculate net growth |
| Comparing unequal periods | A short spike can look stronger than a full period | Use matching weekly or monthly windows |
| Chasing follower volume | It ignores relevance and repeat behavior | Add profile conversion and returning engagement |
| Treating one viral post as a trend | Temporary distribution can distort the month | Review the posts and audience behavior that followed |
| Comparing unrelated accounts | Size, niche, geography, and format differ | Compare with your own historical baseline |
| Mixing engagement denominators | Rates may use followers or impressions | Label every formula's denominator |
| Changing everything at once | You can't identify the cause of improvement | Test one content or distribution variable at a time |
A strong Twitter follower growth rate is not automatically healthy, and a slower one is not automatically weak. Track the math accurately, read it against audience and reach conditions, inspect follower quality, and use the findings to adjust content, replies, profile conversion, and retention.
XBurst helps creators, founders, and brands track follows, unfollows, net growth, engagement, conversations, trends, and scheduled content in one X-focused workflow. Visit XBurst to review the platform and see whether its analytics and growth tools fit your measurement routine.