
Engagement Twitter Analytics: Track What Actually Matters
Master engagement twitter analytics by learning which metrics drive real growth. Benchmark your X performance and turn data into a content strategy that works.

X engagement can look almost invisible by conventional social standards. Socialinsider's 2026 benchmark places X at 0.12% engagement in 2025, down from 0.15% in 2024, and describes it as the lowest-engagement network among the major platforms it tracked (Socialinsider's social media benchmarks). That doesn't mean your content is failing. It means a small change in reply quality, timing, or format can matter more than a large pile of passive likes.
Good engagement Twitter analytics starts with a more useful question than “How many people interacted?” Ask instead: what kind of interaction did this post create, from which audience, and at what level of distribution? A text-first creator, a founder building in public, and a brand account may all see the same engagement rate while getting completely different strategic value from it.
Why Your X Dashboard Feels Confusing Right Now
You publish a thoughtful post, check the dashboard later, and find a familiar mix of signals. Impressions look healthy. Likes are modest. A few people reply, but the engagement rate seems disappointing. It's tempting to label the post a miss and move on.
That conclusion may be wrong. Impressions measure exposure, likes indicate lightweight approval, replies show conversation, and engagement rate measures interaction efficiency. These metrics answer different questions, so they often move in different directions. A post can reach a broad audience without creating much discussion, while a smaller post can attract detailed replies from people who matter to your goals.

Read the dashboard as a set of signals
Consider two hypothetical posts from the same account. The first is a short opinion that spreads widely and collects likes from casual viewers. The second reaches fewer people but attracts replies from customers, peers, or potential partners. If you rank them by raw impressions, the first wins. If your goal is authority or qualified conversation, the second may be more valuable.
The mistake is treating every engagement as interchangeable. A like is easy to give and easy to forget. A reply requires more effort and creates an opening for a relationship. A repost can extend distribution, but it doesn't tell you whether the new audience understood or trusted the argument.
Practical rule: Never judge a post from one metric. Pair reach with interaction quality and the action you wanted people to take.
Give each metric a job
Use impressions to understand distribution. Use likes to detect fast, low-friction approval. Use replies to assess whether the idea created enough tension, usefulness, or curiosity to start a discussion. Use reposts to see whether people considered the content worth passing to their own audience.
The engagement rate then gives you a way to compare efficiency across posts with different levels of reach. This framework prevents a common reaction to weak-looking numbers: posting more often without understanding why the previous content underperformed. The dashboard isn't a report card. It's evidence for your next editorial decision.
The Core Metrics That Actually Matter on X
The most useful X analytics setup separates exposure, response, and efficiency. Each metric has a different role, and none should be interpreted in isolation.
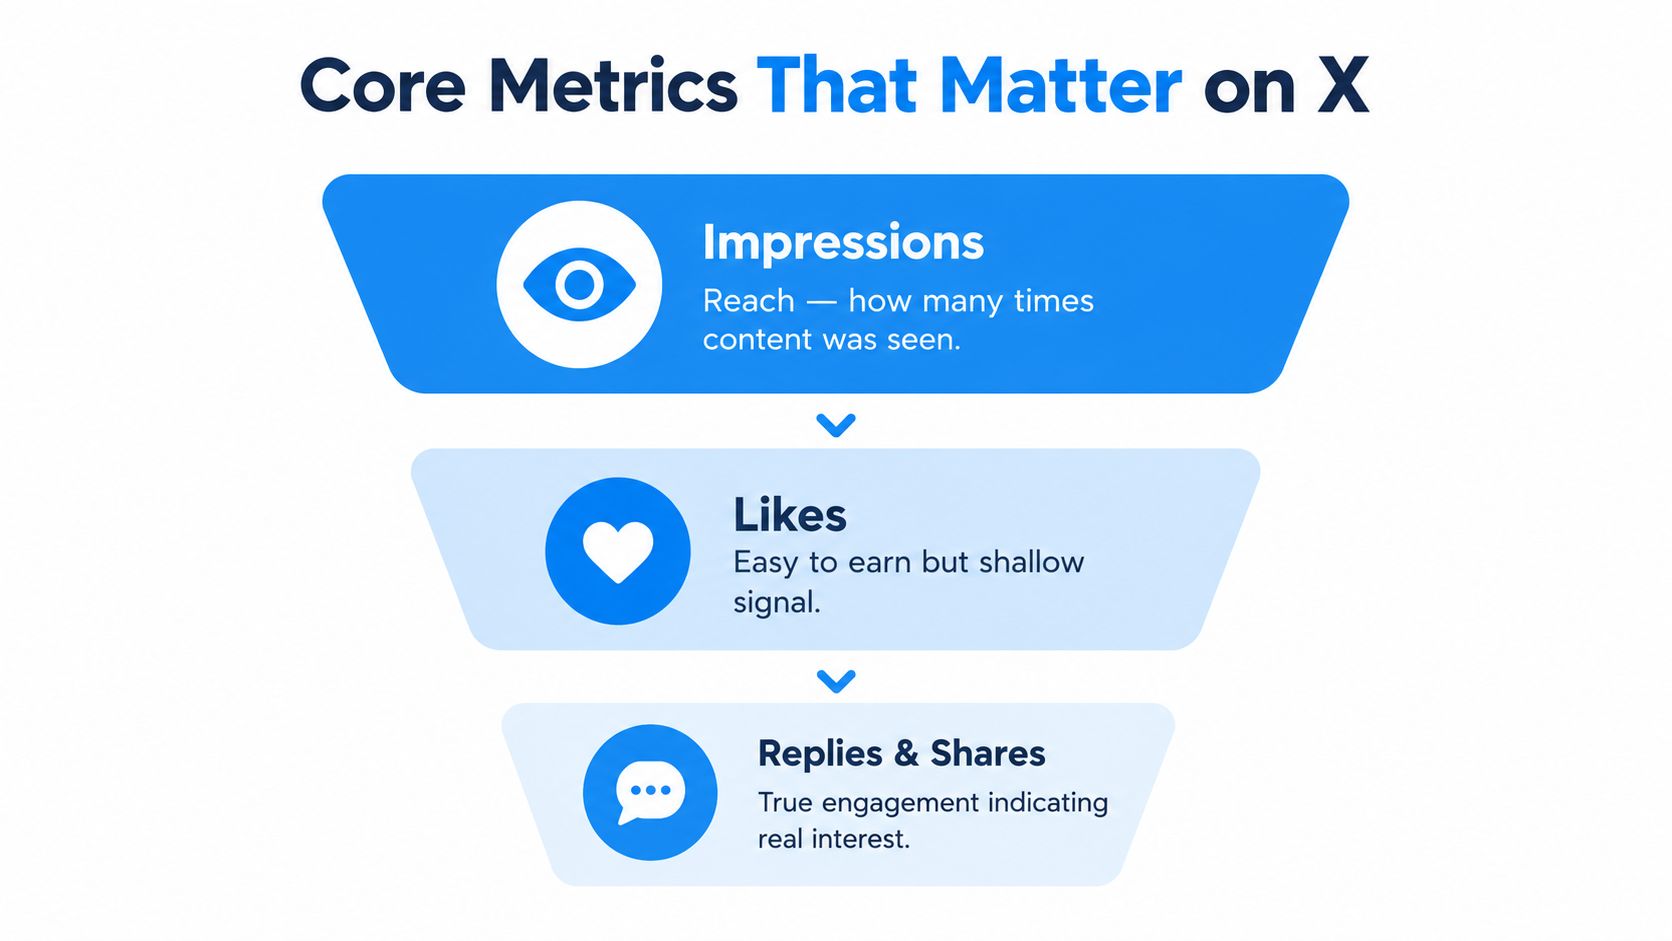
Impressions tell you how often content appeared in front of users. They're a distribution measure, not a satisfaction measure. High impressions can mean the opening earned reach, the topic entered an active conversation, or the algorithm continued showing the post. They don't prove that readers absorbed the point.
Likes are a useful but shallow signal. They can confirm that a post landed emotionally or felt agreeable, but they rarely explain whether the reader wants to continue the relationship. Compare likes with replies and profile visits before treating a high like count as a strategic success.
Replies reveal conversation depth. Read them, don't just count them. A post with fewer replies may be stronger if those replies contain questions, objections, personal experiences, or requests for more detail. Generic reactions provide less evidence of intent.
Reposts indicate distribution beyond your immediate audience. They matter when your objective includes discovery, but a repost alone doesn't tell you whether the new viewers are relevant. Track what happens after the repost, particularly replies, profile visits, and link activity when those metrics are available.
Engagement rate is an efficiency measure
X engagement rate is generally calculated by dividing total engagements by total impressions. The formula is explained in this guide to calculating Twitter engagement rate, and the underlying distinction is important: the result measures interaction per view, not total interaction volume.
Suppose two posts receive the same number of likes and replies. The post shown to a much larger audience will have the lower rate because it converted a smaller share of exposure into action. That doesn't automatically make it worse. It may have introduced the account to more relevant people, or it may have reached a colder audience. The rate tells you about efficiency; the surrounding metrics explain the business meaning.
A practical reading order is:
- Start with impressions: Did the post receive enough distribution to make the comparison meaningful?
- Check engagement rate: Did the post turn exposure into action efficiently?
- Inspect replies and reposts: Did people contribute, challenge, or extend the idea?
- Review downstream actions: Did users visit the profile, click a link, follow the account, or continue the conversation?
This order keeps you from celebrating reach that produces no useful response, or dismissing a focused post because it never became broadly visible.
Benchmarking Your Performance Against Reality
A benchmark is only useful when you know what it measures. X engagement data varies sharply by methodology, account type, audience size, post format, and the denominator used in the calculation. That's why published figures can look contradictory without any of them being wrong.
Buffer's social media engagement benchmark data reports that X's median engagement rate rose from about 2.0% in 2024 to 2.8% in 2025, with text posts reaching 3.56% in its dataset. Those figures describe a particular measurement approach and cohort. They shouldn't be treated as a universal target for every account.
By contrast, Socialinsider's benchmark cited earlier places X at 0.12% in 2025 and identifies it as the lowest-engagement major network in its comparison. Other industry guidance uses still broader ranges. The gap is a reminder that “good engagement” isn't a platform-wide constant. A text-first creator with a responsive niche audience is not competing under the same conditions as a brand publishing promotional messages to a broad follower base.
Build a benchmark that matches your account
Use external data to understand the environment, not to set a blind pass-or-fail threshold. Your own historical baseline should carry more weight because it reflects your audience, publishing habits, topics, and distribution pattern.
Create separate comparisons for:
- Format: Compare text posts with threads, video, images, and link-led posts rather than averaging them together.
- Audience stage: Separate posts aimed at existing followers from posts designed to reach new people.
- Content purpose: Measure authority posts, community questions, product announcements, and traffic posts against their own objectives.
- Account type: A creator, founder, media account, and commercial brand should not share one definition of success.
- Conversation quality: Review whether replies contain substance, not only whether the total count increased.
A creator may reasonably value a high reply rate on a compact text post because conversation is the product. A brand may accept a lower rate on a product announcement if the post generates qualified profile visits or link activity. A founder building in public may prioritize thoughtful objections that improve the next decision.
Use trend lines instead of isolated scores
Record the same metrics consistently and compare similar posts over time. A single weak post can reflect an unusual topic, poor timing, or an audience mismatch. A repeated pattern across the same format is more actionable.
The best Twitter analytics tool for comparing post performance should help you segment results rather than flattening every post into one leaderboard. Your question isn't “Did this beat the industry average?” It's “Did this format become more efficient with this audience, and did the interaction become more useful?”
How Format Choices Drive Engagement Quality
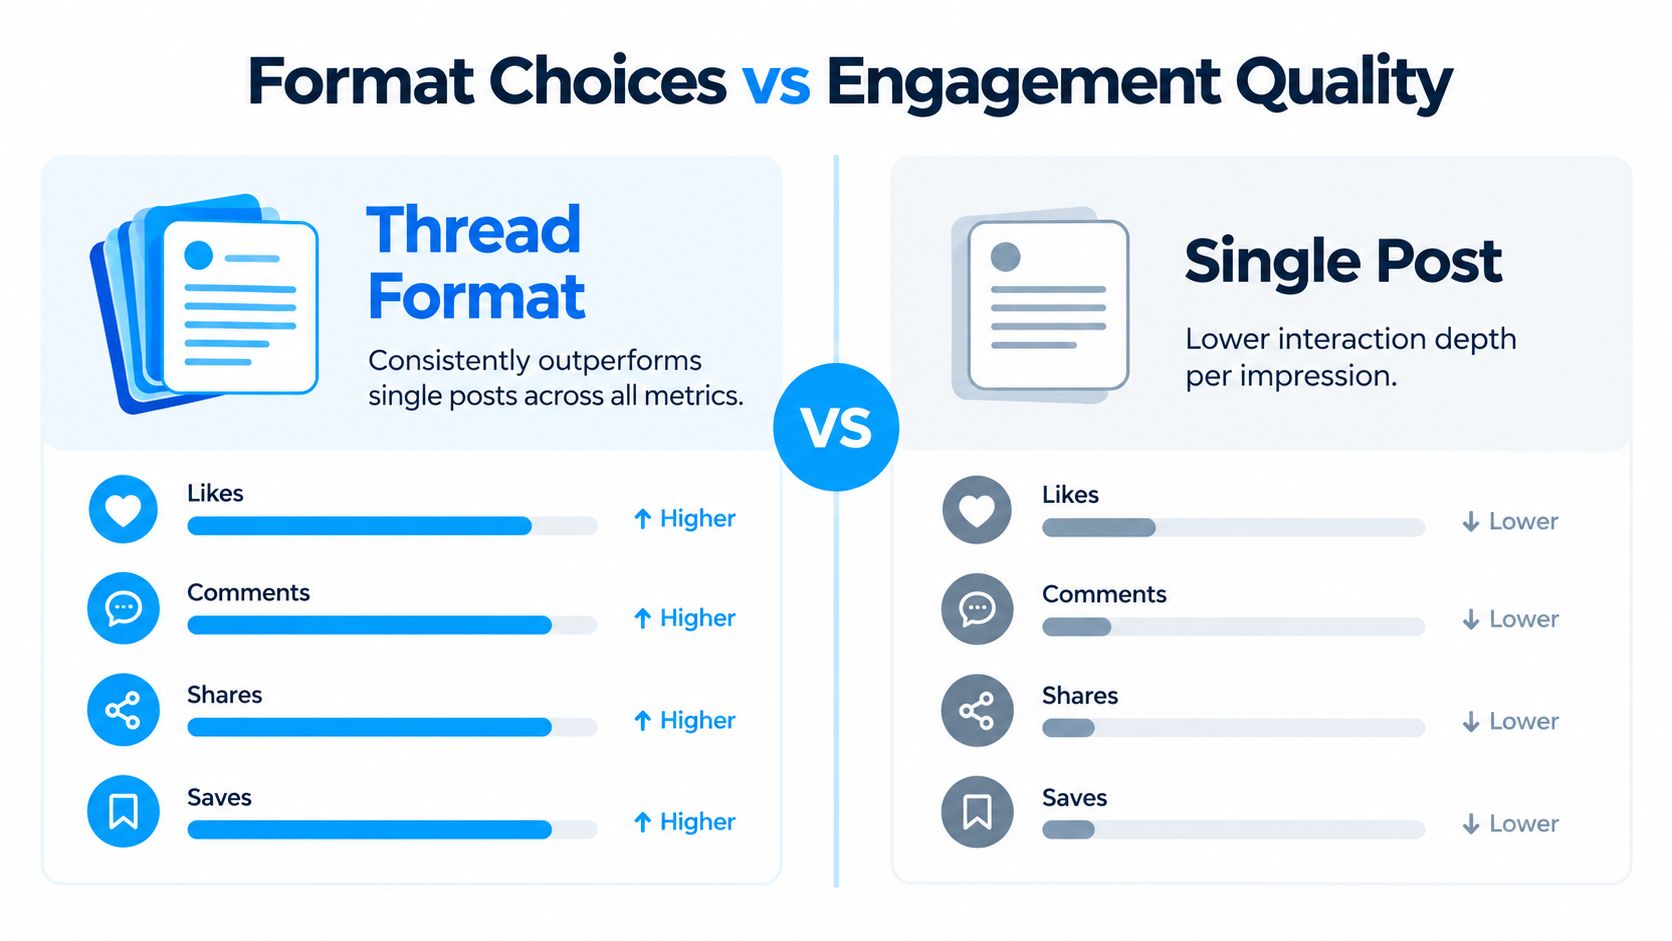
Format is one of the clearest explanations for why two posts on the same topic perform differently. A single post asks the reader to absorb the entire idea at once. A thread creates multiple points of entry, gives the author room to develop an argument, and gives readers more opportunities to respond or repost a specific point.
A 2026 analytics guide reports a 1.89% average engagement rate for threads, nearly three times the rate of plain text and 3.5 times the rate of video in that dataset. Thread posts also averaged 27,508 impressions (TryOrdinal's Twitter analytics guide). These are dataset-specific findings, not a guarantee, but they're strong enough to make format a primary variable in your analysis.
Measure the format before changing the topic
When a thread outperforms a single post, don't immediately conclude that its subject was better. First ask what the structure made possible:
- A stronger opening: The first post establishes a clear promise or tension.
- Progressive value: Each post adds an example, explanation, or consequence.
- More response points: Readers can react to an individual claim instead of the entire argument.
- A deliberate conclusion: The final post gives the reader a reason to follow, reply, or continue elsewhere.
The same guide reports that average retweets per post rose 35% year over year, from 4.93 to 6.67, while average impressions per post fell 5%. That combination matters. Reach can soften while content becomes more efficient at producing active interaction. If you only monitor impressions, you'll miss the improvement.
Create a format-aware measurement routine
Tag every post by format before reviewing performance. For threads, record whether the opening post earned replies, whether later posts added new interaction, and where the discussion concentrated. For video, distinguish views from meaningful actions. For link posts, separate reach from clicks and profile activity.
Review the metrics at different times. Early performance can indicate whether the hook is working, while later performance shows whether the post continued to circulate and attract useful responses. Don't compare a fresh post with a settled one as though they had equal opportunity to perform.
A strong format doesn't rescue an unclear idea, but a suitable format gives a clear idea more ways to earn attention.
Prioritize reply quality over vanity totals. A thread with fewer broad reactions but detailed responses may be teaching you more about audience fit than a high-reach post that generates only passive approval.
Building an Analytics Workflow That Actually Helps
Data becomes useful when it changes the next publishing decision. Start by writing down the account's current objective in plain language. “Grow engagement” is too broad. “Create more qualified conversations around product education” gives you a basis for choosing metrics and reviewing replies.
Set a small decision loop
Choose a primary signal and supporting signals for each objective:
- Authority: Track substantive replies, reposts from relevant accounts, and profile activity.
- Traffic: Track link clicks, profile visits, and the quality of conversations around the link.
- Reach: Track impressions and repost velocity, then inspect whether new viewers respond.
- Community: Track reply volume, recurring participants, and whether discussions continue after the original post.
Review a small set of top and weak posts on a consistent schedule. Look for repeated differences in hook, topic, format, timing, and response behavior. Don't change all of those variables at once. If you change the format and topic together, you won't know which adjustment caused the result.

Turn observations into editorial actions
A useful weekly review ends with decisions, not just screenshots:
- Repeat a structure that consistently produces thoughtful replies.
- Rewrite hooks that earn impressions but fail to create interaction.
- Reserve promotional content for formats and conversations where your audience already shows intent.
- Respond quickly when a post attracts an unusual concentration of relevant questions.
- Retire a format when repeated tests show weak interaction and no compensating business action.
XBurst is one option for this workflow. Its analytics view tracks impressions, likes, replies, engagement rates, and follower change across 7-, 14-, and 30-day windows, while its broader platform also surfaces high-opportunity conversations and supports scheduling. Use any tool only if it reduces manual collection and makes the next content decision clearer.
Shifting From Vanity Metrics To Real Conversations
Likes and reposts are easy to celebrate because they're visible and comparable. They're also incomplete. A post can collect broad approval without creating a relationship, clarifying a customer problem, or giving the team a reason to continue the discussion.
The stronger operating question is whether conversation quality is improving. Hootsuite reports that average comments per post on X rose 107% year over year, even while other metrics remained uneven (Hootsuite's social media statistics). That pattern supports a more careful reading of engagement. More comments can signal stronger interest, but only if the comments are relevant and constructive rather than repetitive or hostile.
Count the response, then read it
A reply-heavy post deserves manual inspection. Classify responses by what they reveal:
- Questions: The audience wants clarification or a practical next step.
- Experience: People are relating the idea to their own work or problem.
- Objections: The post has created useful tension or exposed a weak assumption.
- Low-information reactions: The post may be visible without creating much intent.
- Negative escalation: High reply volume may indicate confusion, criticism, or a reputational issue.
Sprout Social's figures in the Hootsuite source show the same segmentation problem. X influencer engagement averaged 0.39% per post in 2025, while brand median engagement was 0.015% across industries. Those figures aren't interchangeable targets. They reflect different account contexts and reinforce why a brand shouldn't judge its content by a creator benchmark.
A qualified reply can be more valuable than a large collection of passive reactions, but only if your team records and follows up on it.
Track reply-to-impression efficiency alongside total engagement. Then add a qualitative review: Are the same knowledgeable people returning? Are prospects asking about implementation? Are customers describing unmet needs? These answers often reveal more strategic value than a rising like count.
Growth teams should still monitor total engagement. It helps identify distribution and creative momentum. The shift is to stop treating it as the final answer. Optimize for the kind of interaction that supports the account's purpose, whether that's trust, learning, customer support, or demand creation.
Turning Insights Into Your Next Content Strategy
Analytics should produce a clear change in what you publish. Start each test with a hypothesis that names the audience, format, topic, and expected behavior. For example: “A thread explaining product decisions will generate more substantive replies from founders than a thread summarizing industry news.”
Then keep the test narrow. Use the same broad format while changing the hook, or keep the topic stable while comparing a single post with a thread. Review impressions, engagement rate, replies, reposts, and downstream actions together. If replies rise but the discussion becomes irrelevant, the test may have improved attention without improving audience fit.
Act on patterns, not isolated winners
Use these decisions as your operating guide:
- Threads consistently win: Develop recurring thread structures instead of merely increasing posting volume.
- A topic attracts useful questions: Write a follow-up, answer the strongest objection, and invite practitioners into the discussion.
- Video earns attention but little action: Test a different opening or reduce its role rather than assuming the format is automatically valuable.
- A post reaches new people: Watch profile activity and replies before calling it a growth success.
- A format repeatedly underperforms: Change one variable, run another controlled test, and then reallocate effort if the pattern persists.
Use content analysis for social media to connect post-level results with recurring themes, formats, and audience responses. The objective isn't a prettier dashboard. It's a faster feedback loop between what people do and what you create next.
Good engagement Twitter analytics doesn't give every account the same target. It helps you define meaningful performance for your format, audience, and purpose, then spot the conversations worth pursuing before they disappear.
XBurst brings post and reply analytics together with high-opportunity conversation discovery, on-brand content assistance, and scheduling for X creators, founders, and brands. Visit XBurst to explore the workflow and start turning engagement data into more deliberate daily actions.