
Customer Engagement Analytics: A Practical Guide
Learn how customer engagement analytics works, the metrics that matter, and how to turn raw data into real growth on X and beyond.

You publish a post that feels sharp, useful, and perfectly timed. A few hours later, the dashboard shows impressions, likes, replies, reposts, profile visits, and a change in follower count. The numbers look busy, but they don't answer the question you actually have: what should you publish next?
That gap is where customer engagement analytics earns its place. The point isn't to admire a dashboard. It's to connect audience behavior with a decision, then check whether that decision improved the quality of attention, conversation, retention, or conversion.
Why Engagement Analytics Feels Overwhelming and What It's Actually For
Most creators don't lack data. They lack a reliable way to decide which data deserves attention. Impressions suggest distribution, likes suggest approval, replies suggest thought, profile visits suggest curiosity, and follower growth suggests some form of accumulated interest. None of those signals gives you a complete answer alone.
Think of an X analytics dashboard as a cockpit rather than a scoreboard. A pilot doesn't stare at every instrument and pick the largest number. They check the reading that relates to the current decision. A creator deciding whether to improve a hook needs reach and early interaction data. A creator deciding whether to build a recurring series needs retention and return behavior.
The three jobs of engagement data
Useful analytics should perform three jobs:
- Confirm attention: Did enough people encounter the post for the result to be meaningful?
- Identify active interest: Did people respond, reply, repost, bookmark, click, or visit the profile?
- Measure compounding value: Did that interaction lead to follows, return conversations, email signups, product actions, or revenue?
The third job is where many reports become decorative. A post can collect visible interaction without creating a durable audience. Another post can receive fewer likes but attract thoughtful replies from people who return every week. If you judge both by the same surface metric, you'll optimize for noise.
A useful starting point is to stop guessing on LinkedIn metrics and apply the same discipline to X: define the decision first, then select the smallest set of signals that can inform it. Don't ask, “How did this post perform?” Ask, “Should I repeat this topic, change the structure, engage with this audience differently, or stop investing in this format?”
Practical rule: Every metric should have an owner, a definition, and a next action. If nobody knows what changes when the number moves, it isn't a decision metric yet.
The rest of the framework separates exposure from response, response from loyalty, and loyalty from business value. That separation keeps one impressive number from dictating your entire content strategy.
What Customer Engagement Analytics Really Means in 2026
Customer engagement analytics is the practice of collecting, unifying, and interpreting behavioral, sentiment, and outcome signals across the customer journey. It asks how people respond over time, not merely whether they clicked one message or liked one post.
Older reporting systems often treated each channel as a separate box. Email had opens and clicks. A website had sessions and conversions. Social platforms had impressions and interactions. Modern measurement tries to connect those events to a broader customer or audience record, so a reply, profile visit, follow, saved post, and later conversion can be interpreted as related behaviors rather than isolated events.
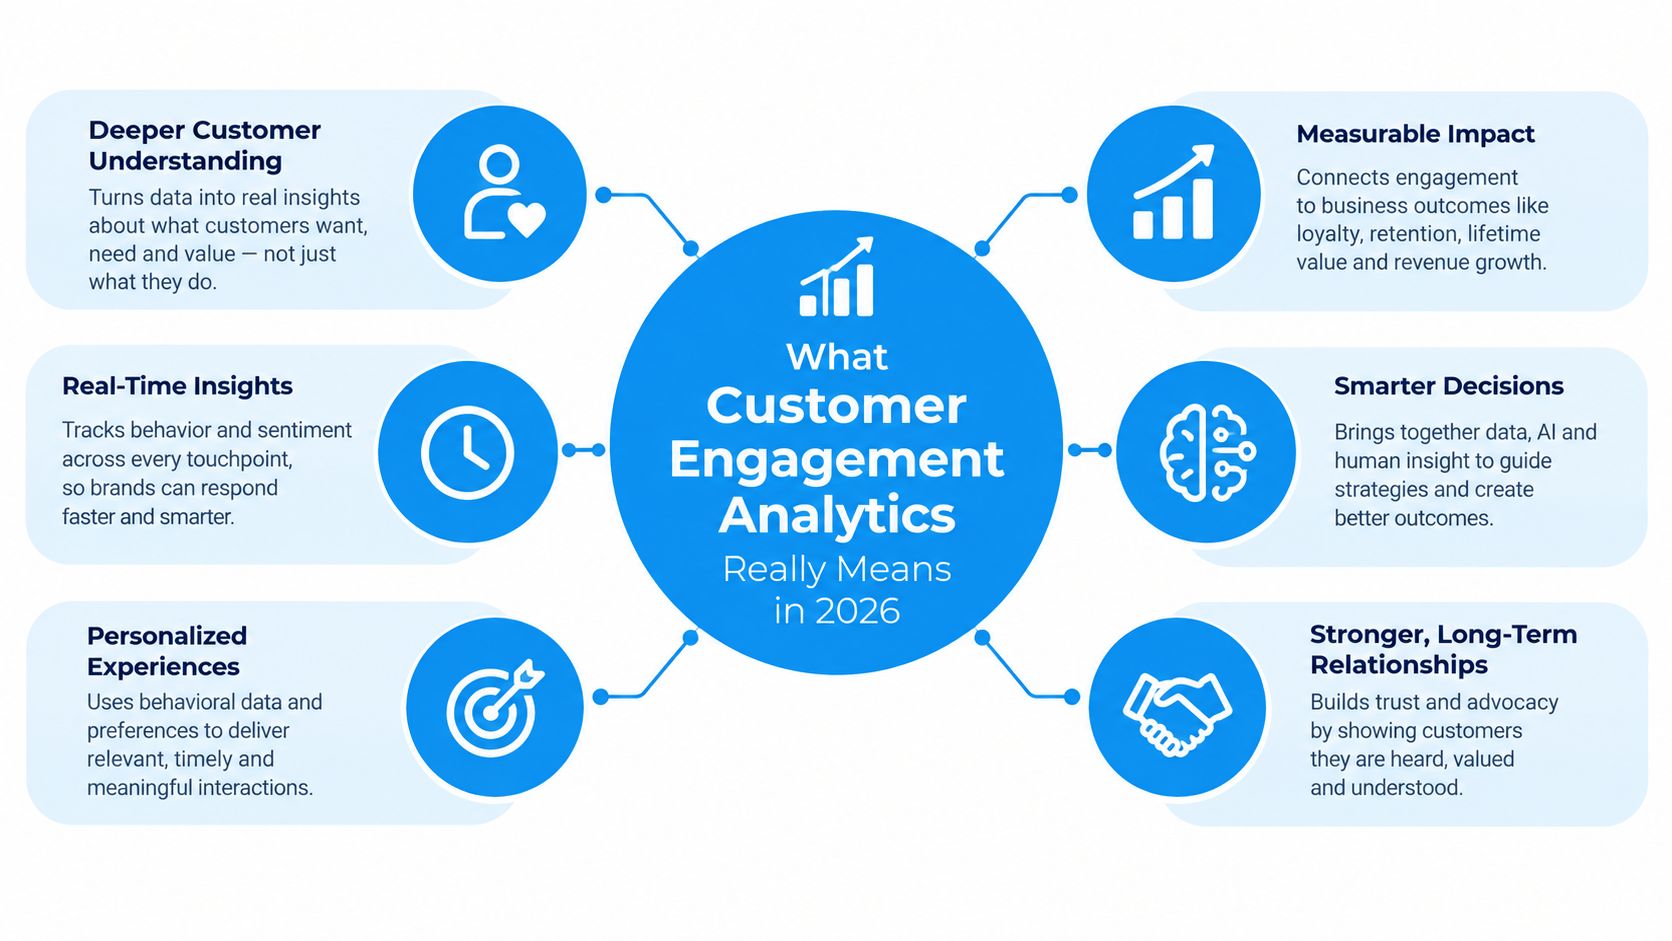
The scale of the shift is visible in recent industry research. Adobe reported that only 39% of businesses had a shared customer data platform ready to support a large-scale rollout of agentic AI in its 2026 customer engagement spotlight, which makes data unification a practical adoption constraint, not a technical footnote. Braze's 2026 review drew on surveys of more than 2,200 marketing leaders and analysis of more than 6 billion data points across 750+ brands, illustrating why isolated campaign reports struggle to represent modern engagement. These figures appear in Adobe's customer engagement research, while the broader AI and engagement context is discussed in Braze's customer engagement review.
Why this matters for X creators
An X creator may not operate a large customer data platform, but the measurement problem is similar. Your audience interacts through posts, replies, quote posts, profile visits, follows, direct conversations, and external links. Treating each event as an equal vote hides intent.
A like often means, “I saw this and approved.” A reply can mean, “This changed my thinking,” “I disagree,” or “I want other people to see my response.” A profile visit indicates curiosity, but not necessarily trust. A follow suggests a stronger commitment, yet it still doesn't prove that the new follower will return.
The useful question is therefore not whether a signal is positive. It is what decision that signal can support. Impressions help evaluate distribution. Replies help evaluate conversational pull. Follow-backs and returning interactions help evaluate audience quality. Link clicks and signups connect attention to an outcome outside the platform.
The AI social media analytics guidance from XBurst is relevant here because automation only improves decisions when the underlying signals are defined clearly. A tool can surface patterns quickly, but the creator still needs to decide which behavior represents meaningful progress.
The Core Metrics and KPIs That Actually Move the Needle
A practical measurement system groups metrics by the job they perform. This prevents a large impression count from competing directly with a conversion signal as if both represented the same kind of value.
| Metric Family | Defining KPI | What It Measures | Common Misread |
|---|---|---|---|
| Reach | Impressions or profile visits | Whether content gained exposure or prompted curiosity | Treating exposure as proof of quality |
| Interaction | Replies, reposts, likes, bookmarks, clicks | Whether people took an active step | Treating all actions as equally meaningful |
| Retention | Returning interactions or follow-backs | Whether attention becomes an ongoing relationship | Assuming a new follower will remain active |
| Sentiment | Reply tone, mention tone, poll response | How people feel about the topic or brand | Reading a high volume of replies as positive sentiment |
| Conversion | Link clicks, signups, product actions | Whether engagement produced a defined outcome | Crediting the last touchpoint for the whole journey |
Reach tells you whether the door opened
Impressions measure distribution, not comprehension. Profile visits are more useful when you want to know whether the post created enough curiosity for someone to investigate the account. Follower delta shows the net audience change, but it can hide both new follows and unfollows.
A post with broad reach and weak profile interest may have a strong topic hook but a vague creator connection. Try tightening the bridge between the claim and your point of view before changing the subject.
Interaction reveals the depth of the response
Likes are lightweight approval. Replies require more effort and often reveal confusion, disagreement, questions, or personal relevance. Reposts suggest that the reader believes the idea is worth distributing to their own audience. Bookmarks can indicate future utility, while clicks show willingness to leave the platform.
Don't rank these actions universally. A community account may value replies above reposts. A founder building awareness may care more about qualified profile visits and reposts. The right hierarchy follows the account's objective.
Retention is where audience quality appears
A one-time reaction doesn't prove an audience relationship. Track whether people return to reply, follow the account after interacting, or engage with later posts. Segment these behaviors by acquisition source, because someone who arrives through a useful reply may have a different intent from someone who discovers the account through a widely distributed thread.
Sentiment needs context
A reply count tells you how much conversation occurred, not whether the conversation helped. Read replies by theme and tone. A controversial claim may produce attention while weakening trust. A practical tutorial may produce fewer visible reactions but stronger signs of usefulness, such as bookmarks, detailed questions, and later follow-up.
Conversion must have a defined destination
A conversion could be a link click, an email signup, a product action, or another outcome you can name and measure. The formula is simple: completed target actions divided by the relevant audience or sessions. The hard part is choosing the correct denominator and avoiding the assumption that the final click created all the value.
For a deeper treatment of post-level evaluation, use this guide to measuring content performance. It helps connect the metric family to the content decision instead of turning analytics into a collection exercise.
Reading the Numbers on X Without Fooling Yourself
Consider an X post that receives substantial exposure, a healthy number of likes, some reposts, and a smaller number of replies. At first glance, the post looks successful. The reach is strong, and the visible approval is easy to screenshot.
The more useful reading separates the signals. Impressions tell you that distribution occurred, but they don't tell you how many unique people noticed the idea or understood it. Likes show passive acknowledgment. Reposts indicate that some readers found the claim distributable. Replies reveal whether the post created enough tension, usefulness, or curiosity to start a conversation.
| Metric | Value | What It Actually Tells You |
|---|---|---|
| Impressions | 48,000 | The post received broad platform exposure |
| Likes | 1,200 | A portion of viewers gave lightweight approval |
| Replies | 90 | A smaller group invested effort in responding |
| Reposts | 40 | Some readers redistributed the idea |
| Reply rate | 0.19% | Conversation depth was modest relative to exposure |
The reply rate in this example is calculated by dividing replies by impressions and expressing the result as a percentage. It helps compare posts with different levels of distribution, but it isn't a complete quality score. A post can have a low reply rate because the subject is highly useful but not naturally conversational. It can also have a low rate because the writing made a strong claim without giving readers a clear way to respond.
Diagnose the structure before changing the topic
Suppose the post opens with a bold claim and closes with a soft call to action. That combination can create attention without creating participation. Readers understand the point, tap like, and move on because the post doesn't give them a specific question, trade-off, or unfinished thought to address.
The correct response isn't automatically to abandon the topic. The hook appears to have earned distribution. The weaker signal is the payload's ability to sustain conversation.
Try one structural change at a time:
- Add a useful tension: Present the common advice, then explain where it fails.
- Ask for a concrete experience: Invite readers to share a workflow, result, or objection.
- Make the claim testable: Give the audience a clear condition under which the idea is true.
- Build a response path: End with a choice, comparison, or question that doesn't feel ornamental.
High impressions with weak conversation usually points to a content-structure problem before it points to a topic problem.
That diagnosis protects you from making a common mistake. If you change the subject every time replies lag, you may discard a strong distribution idea when the actual issue is that readers had no reason to respond.
Turning Raw Metrics Into a Composite Engagement Score
A composite engagement score gives you a consistent way to rank posts and compare performance within a defined account. It combines several actions into one index, which is useful when you need to choose which formats deserve another test.
A simple starting formula is:
((replies × 3) + (reposts × 2) + (likes × 1)) ÷ impressions
The weights are not universal truths. They encode a business decision. Multiplying replies by three gives conversation more importance than a like. Giving reposts a weight of two recognizes distribution value without treating it as equivalent to a deeper response.
Set weights around the account's purpose
A creator building a peer community may increase the emphasis on replies and repeat conversations. A founder trying to spread a clear category idea may give reposts more weight. A product account may need a separate conversion layer because an interaction score cannot prove that someone signed up or activated a feature.
Keep the score stable while you compare a batch of posts. If you change the weights every time you see an unexpected result, the score stops being a measurement tool and becomes a justification tool.
The score also needs a denominator and a time window. Comparing a new post with an older post after different periods of distribution can create a false conclusion. Use consistent windows where possible, then examine the underlying actions before making a decision.
Segment the score by cohort
The same score can represent different audience quality. Separate people acquired through replies, threads, reposts, profile discovery, and external links. Then compare whether each cohort returns, replies again, visits the profile, or converts.
A weak score among newly acquired followers may suggest that the content attracts attention without setting expectations. A weak score among long-term followers may point to audience fatigue or declining relevance. A weak score from paid or externally sourced traffic may indicate a channel mismatch rather than a writing problem.
Use the score as a sorting mechanism, not as a verdict. A high score tells you which post deserves inspection. It doesn't tell you why the post worked, whether the audience will return, or whether the result supports your commercial objective.
The Uncomfortable Truth About Data Quality and Dark Data
More dashboards won't repair incomplete measurement. They can make the problem harder to see by giving an unsupported number a polished presentation.
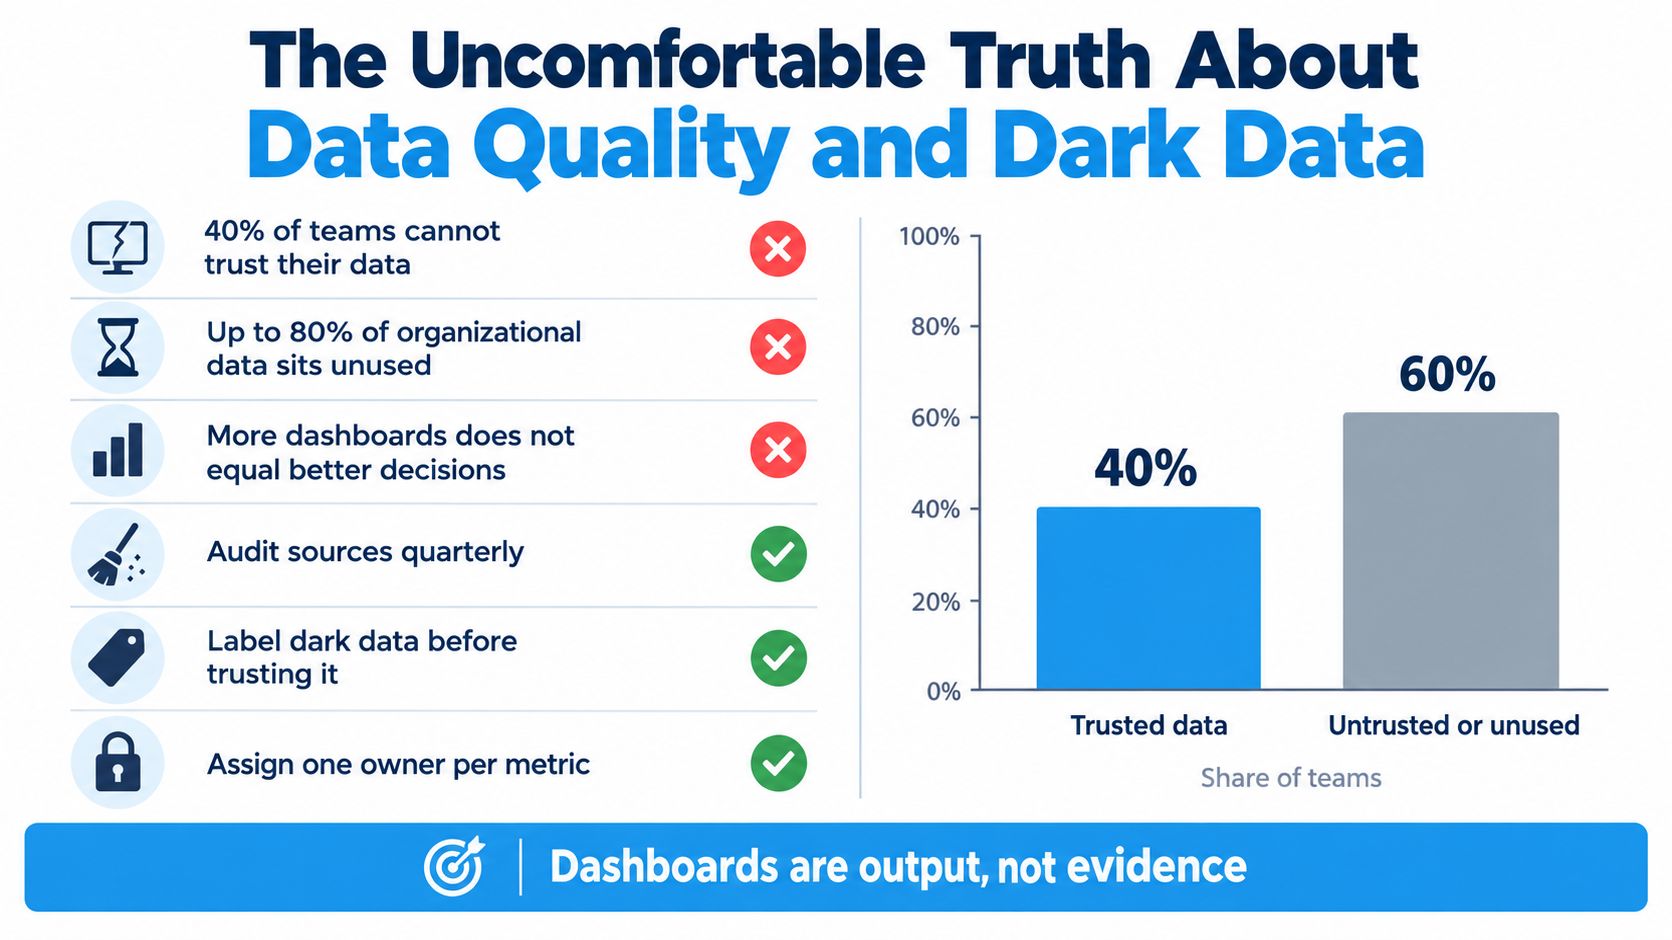
The G2 report on AI in customer engagement identifies data quality issues, incomplete journeys, and missing feedback loops as major barriers to useful engagement analysis. The verified research summary also notes that SAP reports 60% of organizations suffer from dark data, meaning information is collected but not used across the customer journey. The practical lesson is uncomfortable: a team can track many events and still lack enough trustworthy evidence to make a good decision.
What dark data looks like for a creator
Dark data isn't limited to enterprise systems. On X, it can include signals that never reach your working report or never receive a clear interpretation:
- Bookmarks: A reader may save a post for later without liking it.
- Direct conversations: A post may lead to a private question that standard public metrics don't capture.
- Profile visits: Curiosity may rise without an immediate follow.
- Unfollows and mutes: Negative or declining audience response may remain invisible in a simple engagement rate.
- Reply context: A reply count can't show whether responses express agreement, confusion, or distrust.
You don't need to expose every hidden signal to improve your process. You need to know which important behaviors are missing, which are available, and which are reliable enough to use.
Give every metric a definition and an owner
Ownership matters more than dashboard volume. If one report defines engagement as likes and another includes replies, clicks, and reposts, the team isn't comparing performance. It's comparing different concepts that happen to share a label.
Run a compact audit:
- Instrument the important events: Confirm that the actions tied to your goals are captured.
- Define each metric: Write the numerator, denominator, time window, and exclusions.
- Assign one owner: Someone must maintain the definition and answer questions about changes.
- Compare by cohort: Separate acquisition source, audience age, format, and intent.
- Prune regularly: Remove metrics that don't influence a decision.
Dashboards are output, not evidence. Evidence begins with a complete event definition and a trustworthy path from behavior to outcome.
This hygiene also protects AI-assisted analysis. An automated system can summarize patterns quickly, but it can't turn missing events into reliable evidence. More tracking isn't always better if nobody knows how the signals connect.
How XBurst Puts This Framework to Work Day to Day
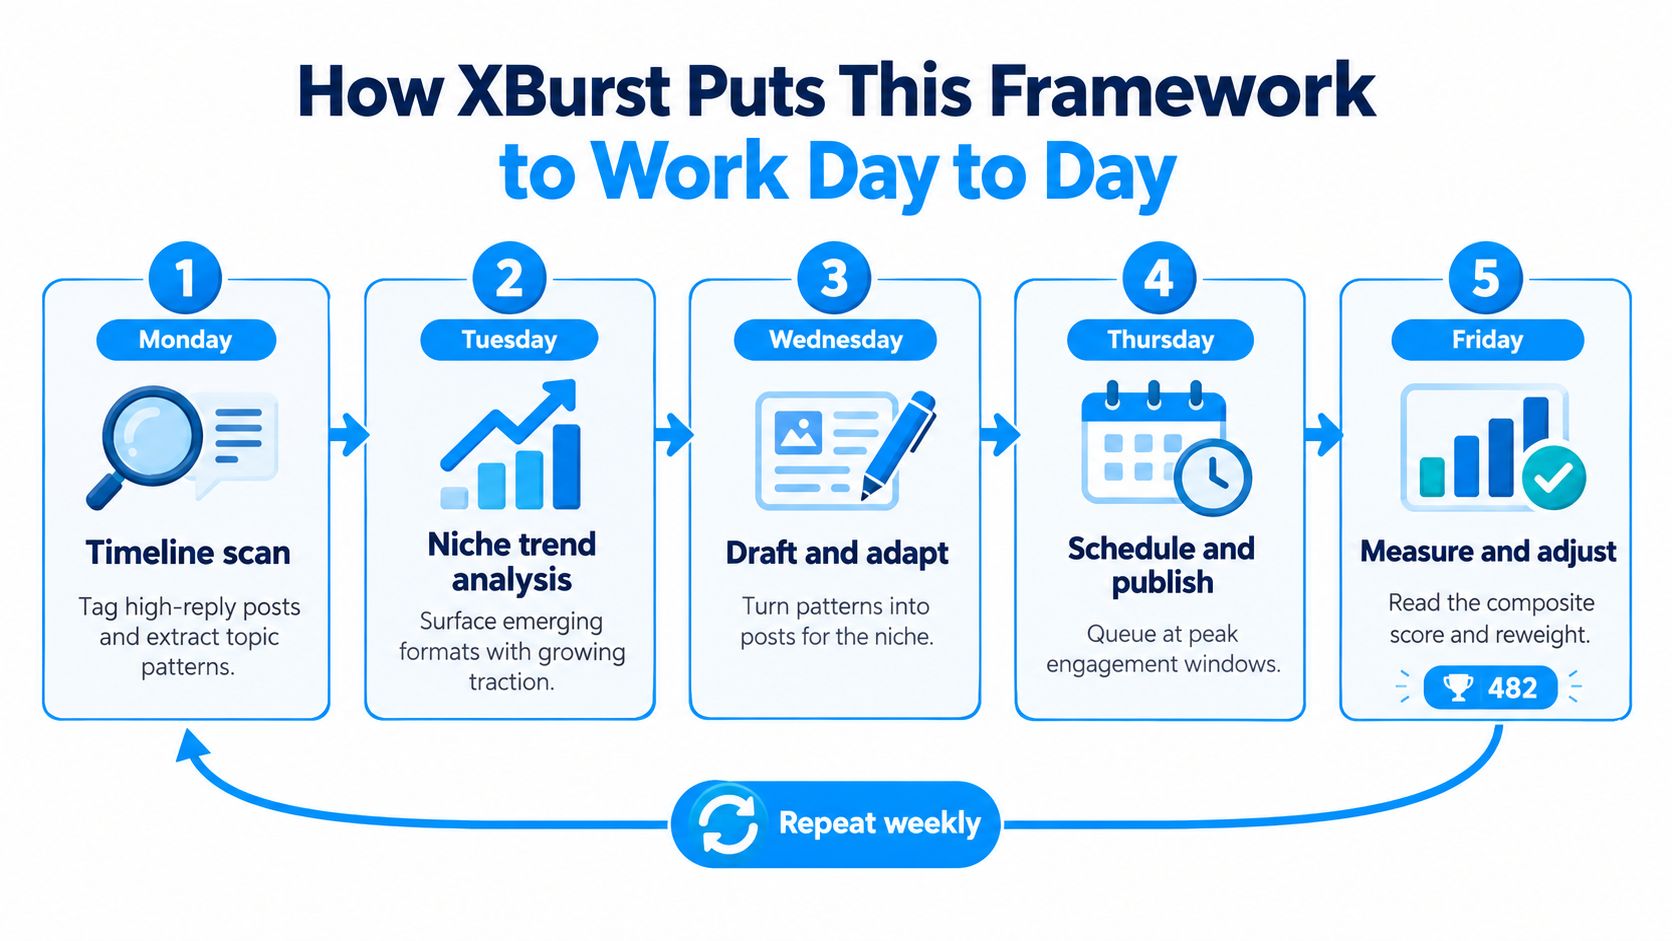
A useful workflow turns measurement into a weekly operating rhythm. Instead of checking every metric after every post, assign each day a decision and connect it to one metric family.
Monday starts with observation
Scan the timeline and tag posts that generate meaningful replies, not just visible reach. Record the topic, opening structure, format, audience, and type of response. The point is to build a small pattern library from conversations that already show evidence of interest.
A social analytics platform can reduce manual sorting. The platform can scan conversations, surface high-opportunity threads, and organize observations so the creator spends more time interpreting the pattern than searching for it.
Tuesday tests the niche
Review emerging topics and formats. Compare reply quality, repost behavior, profile visits, and the audience context around each opportunity. A rising conversation isn't automatically a good fit. It needs a connection to the creator's expertise and a reason for the target audience to care.
Track whether the opportunity produces active interaction or merely exposes the account to a broad but irrelevant audience. That distinction protects growth teams from chasing every visible trend.
Wednesday turns evidence into content
Draft a post or reply using the patterns collected earlier. Keep the writing grounded in the account's own voice, then choose a structure that matches the intended signal.
If the goal is conversation, create a clear point of disagreement or a practical question. If the goal is distribution, make the central idea easy to understand and share. If the goal is conversion, connect the post to a specific next action and make the destination consistent with the promise.
Thursday publishes against a benchmark
Use the account's composite score as a reference point, not a target to manipulate. Compare the new post with similar formats and topics rather than with every post in the account. A thread should be judged against other threads, and a reply should be judged against comparable replies.
The platform's analytics view can help creators review impressions, likes, replies, and rates across defined reporting windows. That makes it easier to identify patterns without treating one unusually distributed post as the account's new normal.
Friday reviews cohorts and adjusts the next cycle
Look beyond the post itself. Compare the people who discovered the account through replies with those who arrived through threads or profile visits. Check whether they returned, followed back, replied again, or took the intended external action.
A creator might find that threads consistently create more conversation than single posts. That observation is only useful after checking whether the additional attention produces profile visits, follow-backs, and returning interactions. If it does, the creator can adjust the schedule and keep monitoring retention-style signals rather than assuming the format change worked permanently.
The process described in this social media analytics platform overview works because it joins discovery, creation, distribution, and review. The tool doesn't replace judgment. It gives the creator a repeatable place to apply judgment, with the same definitions and benchmarks carried from one week to the next.
XBurst helps creators and growth teams scan X conversations, identify promising topics, generate on-brand replies and posts, schedule content, and review impressions, likes, replies, and rates in one workflow. Visit XBurst to explore the platform and use its trial to build a weekly engagement analytics process around the signals that matter to your audience.